by Shraddha Kakade and Zhejun Li (Emerald)
According to the World Health Organization (WHO), air pollution is the world’s single largest environmental health risk.
According to the WHO 2012 estimates, one in every eight deaths of the total global deaths were linked with air pollution and an estimated 7 million deaths in 2012 were associated with indoor and outdoor air pollution.
Understanding ambient air pollution
Outdoor air pollution, also referred to as ambient air pollution is typically measured by the scientist in terms of the size of dust particles found in the air. PM 2.5 refers to particles of diameter 2.5 micrometers or smaller– to put things in perspective PM2.5 are as fine as one-30th the size of human hair. It primarily includes a mixture of sulfate, black carbon, nitrates, ammonia, sodium chloride, mineral dust and droplets of water.
PM 2.5 is considered the most health-damaging pollutants owing to its size and its capacity to easily enter lungs, blood tissues and cause severe breathing and respiratory problems. The primary source for PM 2.5 pollutants include emissions from vehicles, construction sites, burning of fossil fuels such as wood, coal and other natural resources. Plus, sand or dust storms, volcanic eruption and forest fire are one of the common factors of PM 2.5 pollution.
Air quality is typically measured by the scientist in terms of daily or annual mean concentration of PM 2.5 in micrograms per cubic meter of air volume. According to the WHO guidelines for safe air, the acceptable annual mean of PM2.5 concentration is 10 micrograms per cubic meter and for 24-hour mean concentration, it is 25 microgram per cubic meter.
Graph 1: Global trends in PM 2.5 pollution between 2010 – 2015

An analysis of the PM 2.5 data of all countries between 2010 to 2015 reflects that developing and low-income countries in Southeast Asia, Africa, and Western Pacific regions have the highest annual mean exposure to PM 2.5.
As seen in graph 1, Saudi Arabia has the highest PM 2.5 mean annual exposure over the past five years with an average of 123.9 microns per cubic meters, followed by Qatar and Egypt and Kiribati has the lowest PM 2.5 concentration with 3.37 microns per cubic meter, followed by American Samoa and Samoa.
Graph 2 and Graph 3 which plot the top most polluted and least polluted countries reflect the geographical discrepancies that exist in ambient air pollution.

Graph 2: Top polluted countries between 2010 to 2015

Though it is often cloaked in a fetid smog, China didn’t have the most toxic air in the world, at least over the past five years. Nor did India, despite its congested roads and belching power-stations. The top five countries with highest PM2.5 concentration were Saudi Arabia, Qatar, Egypt, Niger and Kuwait.
As you can see in the above map, the top five most polluted countries were located either in the Middle East or North Africa and their average PM2.5 all exceed 90μg/m3, which is nine times higher than the acceptable standard (10μg/m3) and exceed No.12 India and No.19 China, with 68.2μg/m3 and 57.6μg/m3 respectively.
So, what are the factors that cause those Middle East countries had such a high PM2.5? To begin with, countries like Saudi Arabia and Qatar are located in an arid region and dust storm takes place frequently. According to the Egyptian Journal of Report Sensing and Space Science air pollution report, 2016, dust storms were one of the main contributors of PM2.5 pollution in Saudi Arabia and other arid regions. The report highlighted that topography, winds, and temperature contribute to the concentration of PM 2.5 ambient air pollution.
As per the report, in addition to dust storms, those countries’ heavy oil combustion, resuspended soil, power generation, industrial emissions, desalination and traffic emissions all attributed to the high PM2.5 concentration.
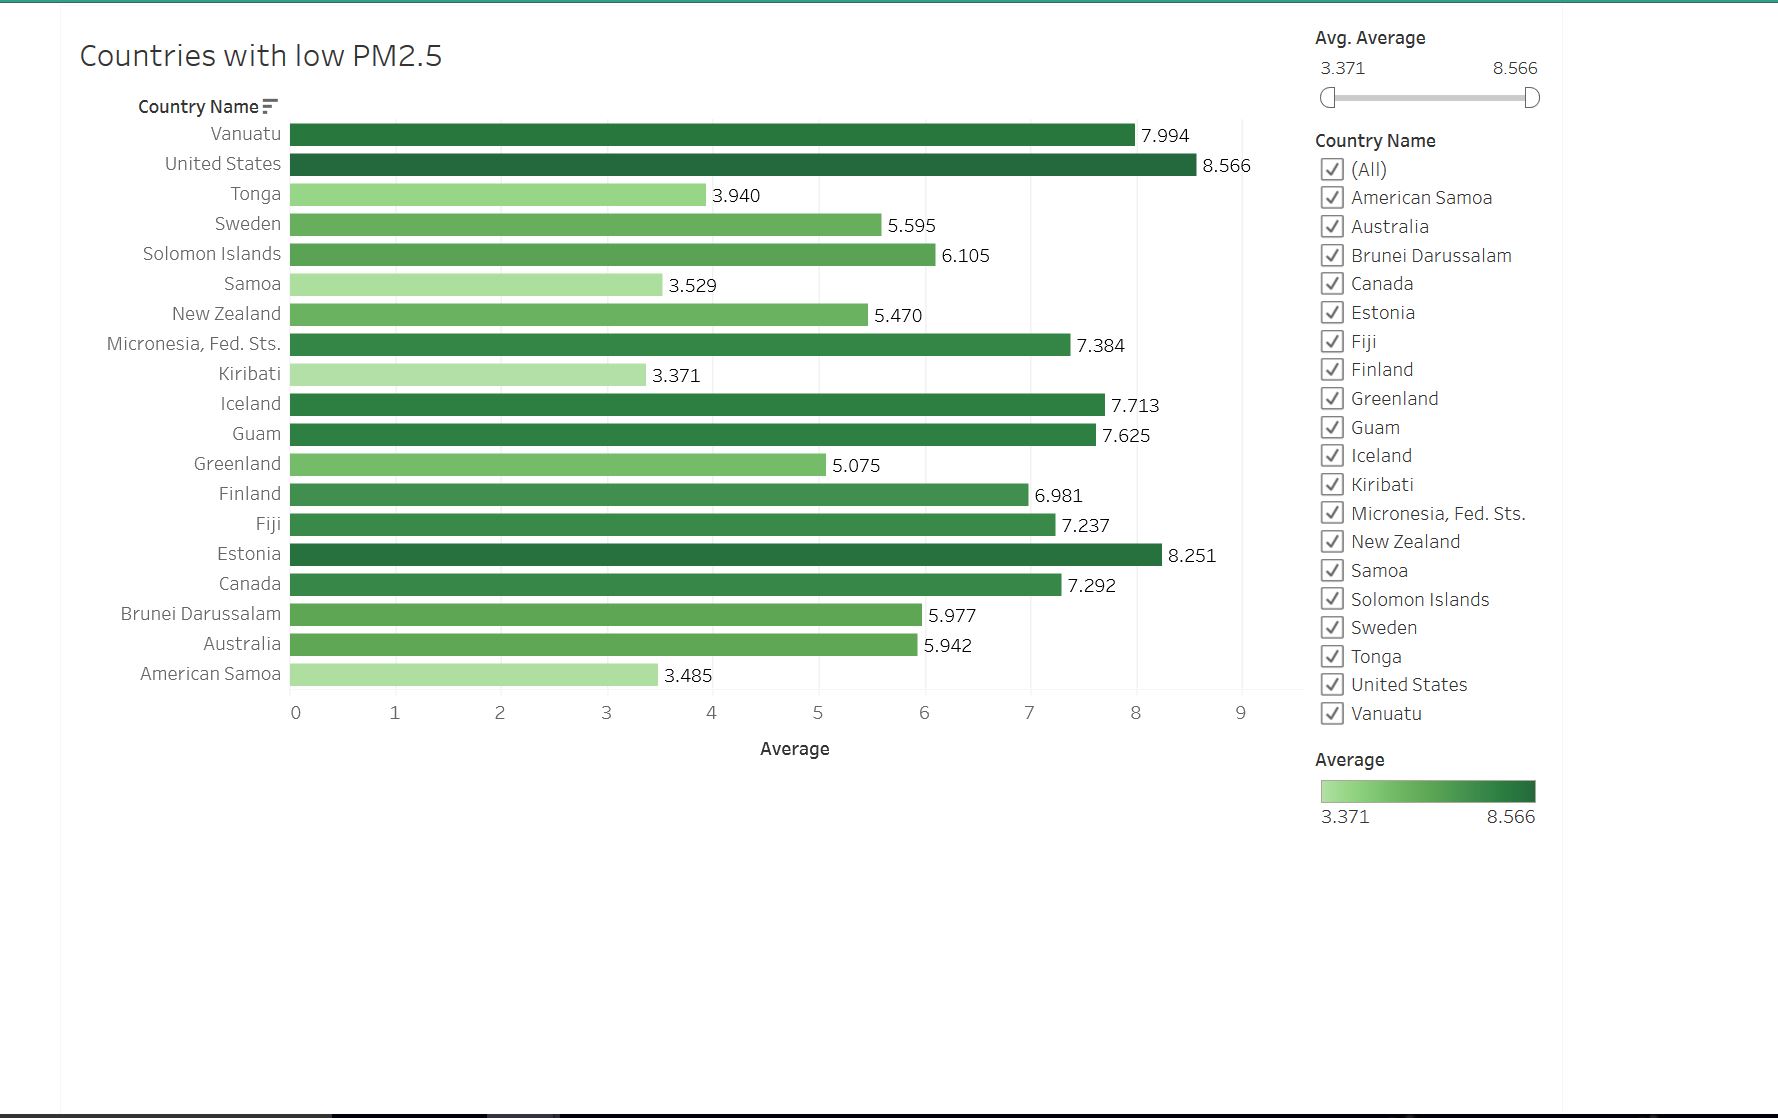
Graph 3: Least polluted countries between 2010 to 2015

The map above shows the least polluted countries are gathered around Europe, North America and the Pacific Ocean such as Australia and New Zealand. None of those countries’ PM2.5 exceed 8.6μg/m3, which is even lower than the standard 10μg/m3. Over the past 5 years, Kiribati had the lowest PM2.5 with an average of 3.5μg/m3.
Countries with highest percentage change and least percentage change in PM 2.5 pollution
When we looked at the percentage increase in PM 2.5 pollution over the past five years, we saw that Costa Rica had the highest increase in PM 2.5 pollution between 2010 to 2015 and Niger had seen the least percentage change.


Souces
https://data.worldbank.org/indicator/EN.ATM.PM25.MC.M3?end=2015&start=2015&view=map
http://www.sciencedirect.com/science/article/pii/S1110982316300230