Quantifying Infant Reach and Grasp

- Posted by ostadabbas
- Posted in Research
Instructions on Quantifying Infant Reach and Grasp
Reported by: Victoria Berry, Franklin Chen, Muskan Kumar
ACLab Students Mentors: Dr. Elaheh Hatami and Pooria Daneshvar
YSP/REU Summer 2023
Abstract:
In the United States, approximately 7% percent of children are affected by neurodevelopmental delays; however, only about a third of children under the age of five receive recommended developmental screenings. This delayed screening can impact children who are at risk for neurodevelopmental delays—such as autism spectrum disorder, cerebral palsy, etc.—to not receive proper support in time and have more difficulties in academics, social interactions, and other long-term developments. This research project focuses on developing a monitoring device able to provide developmental screenings and detect motor abnormalities in infants using computer vision and machine learning. Data was gathered and processed from raw video footage of infants naturally interacting with their environments, then fed to machine learning models to learn the representations of motor functions. Large quantities of short clips showing infants performing certain motor functions, and images during peak action were extracted from longer home videos to serve as a benchmark for training the infant action recognition models. Our research focuses on understanding, identifying and predicting infant behaviors by approximating their behavioral, physical and psychological conditions. The infants’ actions were separated into several categories, including holding, reaching, and grabbing. These actions were identified based on the completion of the action. Additionally, the raw home videos had been annotated for the different motor functions displayed. Infant pose and joint coordinates were estimated using pose estimation models applied on each image as low-dimensional representations of their motor function. The skeleton-based representations provide researchers and computer vision models a better understanding of typical infant motor functions and will be fed to deep neural networks to automatically detect infant abnormalities.
Background:
Neurodevelopment refers to the development and organization of the central nervous system and its functions. This complex development of the brain determines the functional or observable abilities of a child later in life. During the first few years of a child’s life, major developmental milestones are obtained, such as gross motor abilities, fine motor skills, language abilities, and problem-solving skills[1]. It is of utmost importance for children to develop these skills, for each skill can influence the development of others. However, in the United States, approximately 7% of children are affected by neurodevelopmental delays, and only about a third of children under the age of five receive recommended developmental screenings[2]. Neurodevelopmental delays can occur at any time during the early developmental stage to around five years old and persist their entire life; therefore, it is crucial they receive medical screenings to encourage psychological and neurodevelopment[3]. Delayed screenings can impact infants and children who are at risk for neurodevelopmental delays such as congenital torticollis, autism spectrum disorder, and cerebral palsy, and cause them to not receive proper support in time and have more difficulties in social interactions, academics, and other long-term developments. Abnormal neurodevelopment in children can impact at least one domain of functioning abilities, such as motor skills development[4]. Identifying possible neurodevelopmental delays in children as soon as possible is therefore pivotal in creating a future that can reach its full potential. Using a low-dimensional subspace referred to as “pose”, a brief identifiable representation of important information. The state can then be predicted and envisioned from this low-dimensional representation. A great deal of information can be interpreted from the pose and can be used as a semi-managed generative model to render and enlarge the labeled examples for the purpose of data augmentation for the deep learning processes.
Research Objective:
The objective of this research is to use artificial intelligence and computer vision to create a monitoring device that is able to provide developmental screenings and detect signs of physical and cognitive abnormalities in infants. This will assist in detecting any neurodevelopmental delays as early as possible and will signal whether a child potentially needs screenings. This can significantly improve a child’s life with neurodevelopmental delays since the delays can be detected much earlier in the developmental stage. Our research evaluates infant poses because of the significant growth infants undergo throughout their childhood. As well as the significant postural differences between adults has left researchers with questions about infants and their neurodevelopmental health over the period of infancy to the age of 5. Our goal is to collect data for a computer vision based method for the assessment of postural symmetry in infants in addition to providing infants with treatment of issues associated with motor and neural development.
Methods for Data Collection:
The Augmented Cognition Lab is currently running an at-home study that requires the collaboration of parents to collect videos of the infants performing daily activities, such as eating and playing. Data is collected with the infants in their most natural environment and sent to the lab. From there, the raw home videos are cut down into multiple three to five second clips displaying relevant motor skills. The different actions involved with the activities are sorted into separate categories—such as holding, grabbing, and reaching for the infants playing with a ball—to organize the dataset. The video clips will also be converted into optical flow videos. The modified video clips are then used to create a CNN-LTSM (long short-term memory network). The LTSM network processes sequence prediction problems with spatial inputs and time dimensions. The network will provide information about the infants’ motor development based on physical and emotional behaviors. Images of the infants during peak action were also extracted from the video clips and sorted into their appropriate categories. These video clips and images were stored to their respective folders in a main Google Drive lab folder. The collected images were also run through MediaPipe Pose, a Python-based program, which estimated the joint coordinates and infant pose onto the images as low-dimensional pose and body landmark representations for the machine learning models. These skeleton-based representations will provide researchers, as well as the machine learning and computer vision models, with a better understanding of typical infant motor function while interacting with their environments. The new images generated by MediaPipe Pose will be fed to deep neural networks to help automatically detect infant abnormalities. These new images were also sorted into their respective category folders within the main Google Drive folder.

Figure 1: Image of an infant grabbing a ball with their left hand

Figure 2: Image of infant with pose estimation and marked joint coordinates using MediaPipe Pose
Supervisely, a computer vision and machine learning platform, was also used to further annotate the raw home videos. These annotations served the purpose of tagging the specific time frames for the different motor functions displayed—such as holding, grabbing, chewing, and placing food in their mouth—to help the machine learning models understand the data. The annotations for the different actions and their time frames were exported from the program, and a frame code was created for further use in the research.
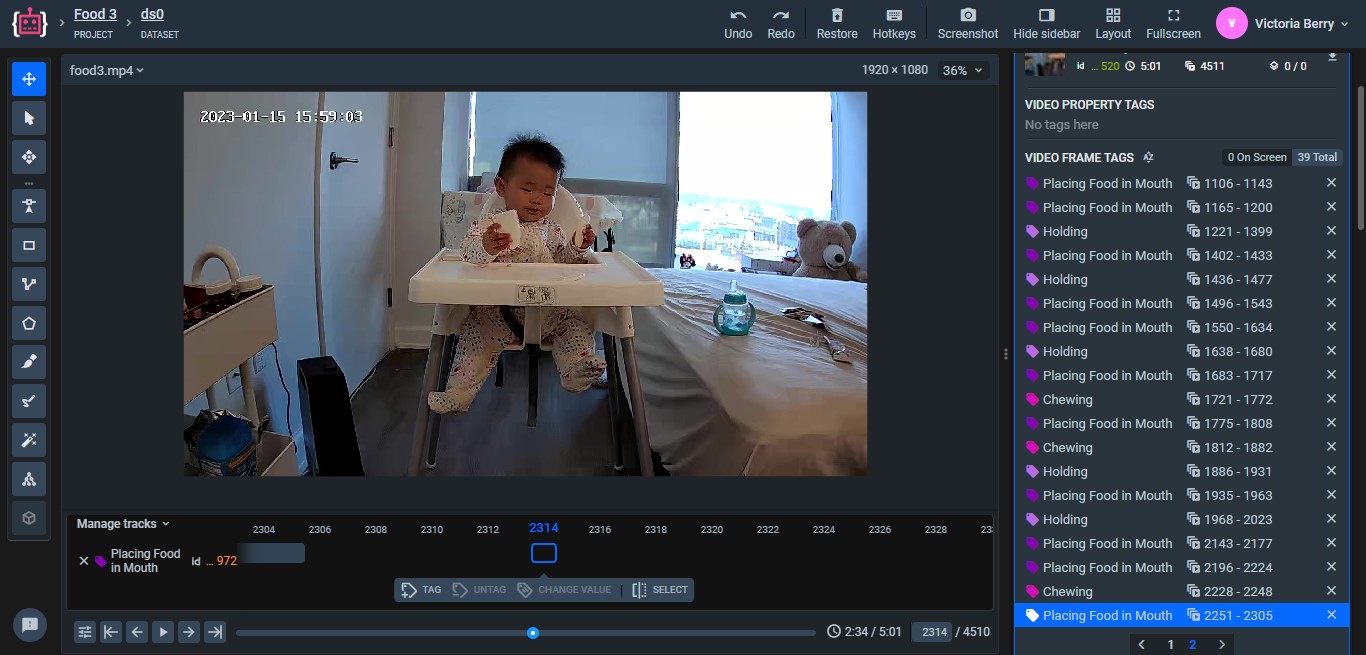
Figure 3: Video of infant eating and drinking being annotated with tags using the platform Supervisely
Further data collection was performed on the video clips, by examining each infant’s movements when performing different actions—such as which hand they used when grabbing, reaching, or holding with the ball and the ball’s relative position. Excel was used to organize the newly collected data, perform data analysis, and create graphs based on the new data. These graphs displayed the percentage of time each infant performed certain movements during different actions. These newly collected data assist researchers and the artificial intelligence to become familiar with infant motor patterns and detect irregular behaviors—such as never using their left hand.
Graphs:

Figure 1. Displays how many samples were collected for each infant and which hand they used to perform reaching for the ball when it was on their left side.
This graph displays the percentage of the time infants 2, 3, 4, and 5 use each hand to reach a ball that is on their left side. Based on the data, Infant 5 uses their left hand around 60% of the time to reach for a ball that is on their left side. Infant 4 uses their left hand a little less than 90% of the time to reach for the ball and uses either both or only their right hand equally—around 7%. Infant 3 only uses their left hand around 35% of the time, and uses both hands at the same time 65% of the time. This is consistent with the previous graph that shows that for a majority percent of the time, Infant 3 uses both hands when the ball is on the right side. This likely means that Infant 3 will probably use both hands to reach for the toy regardless of what side it is on. Infant 2 uses their left hand to reach for a ball on their left side around 85% of the time. There was not enough sufficient data for infants 1 and 6.
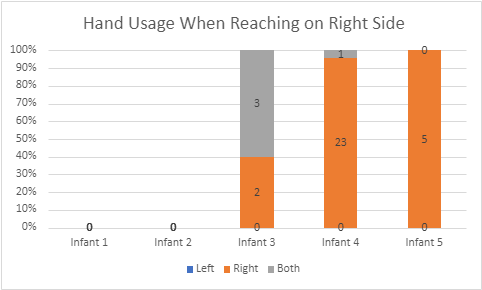
Figure 2. Displays how many samples were collected for infants and which hand they received while performing the reaching action specifically when the ball was on their right side.
This graph displays the percentage of the time infants 3, 4, and 5 use each hand to reach a ball that is on their right side. Based on the data, Infant 5 uses their right hand 100% of the time to reach for a ball that is also on their right side. Infant 4 uses their right hand around 95% of the time, while Infant 3 only uses their right hand 40% of the time, and uses both hands at the same time 60% of the time. There was not sufficient data for infants 1, 2, and 6.

Figure 3. Displays how many samples were collected for each infant and which hand they used to grasp for the ball on their left side.
This graph displays the percentage of the time Infant 2, 3, 4, and 5 use each hand to grab a ball that is on their left side. Based on the data, Infant 5 uses their left hand 80% of the time to grab the ball on their left side, but still uses their right hand 20% of the time. Infant 2, 3, and 4 all used their left hands 100% of the time to grab a ball on their left side. There was not sufficient data for infants 1 and 6.

Figure 4. Displays how many samples were collected for each infant and which hand they used to grasp for the ball when it was on their right side.
This graph displays the percentage of the time infants 3, 4, and 5 use each hand to grab a ball that is on their right side. Based on the data, Infant 5 uses their right hand 50% of the time to reach for a ball that is also on their right side. Infant 4 and Infant 3 use their right hands 100% of the time to grab a toy ball on their right side. There was not sufficient data for infants 1, 2, and 6.
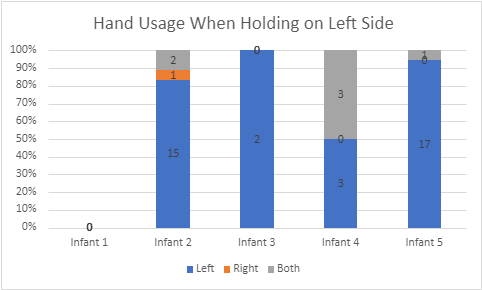
Figure 5. Displays how many samples were collected for each infant and which hand they used to hold the ball when it was on their left side.
This graph displays the percent of the time infants 2, 3, 4, and 5 use each hand to hold a ball on their right side. Based on the data, Infant 5 uses their left hand nearly 95% of the time to hold a toy ball on their left side. Infant 4 uses their left hand half the time, and both hands the other half. Infant 3 uses their left hand 100% of the time to hold a ball on their left side, and Infant 2 uses their left hand a little over 80% of the time. There was not enough sufficient data for infants 1 and 6.

Figure 6. Displays how many samples were collected for each infant and which hand they used to hold the ball when it was on their right side.
This graph displays the percent of the time infants 3, 4, and 5 use each hand to hold a ball that is on their right side. Based on the data, Infant 5 and Infant 2 use their right hands 100% of the time to hold a ball on their right side. Infant 4 uses both of their hands most of the time, their right hand around 30% of the time, and a little less than 10% of the time for their left hand. There was not enough sufficient data for infants 1, 3, and 6.

Figure 7. Displays how many samples were collected for each infant and which hand they used to hold the ball when it was in the center of them.
This graph displays the percent of the time infants 1, 2, 3, 4, and 5 use each hand to hold a ball in the center of their torsos. Based on the data, Infant 5 uses both hands nearly half the time, their left hand about 25% of the time, and their right hand about 30% of the time. Infant 4 uses both hands for a little more than 80% of the time, while infants 3 and 2 use both hands 100% of the time. Infant 1 uses their right hand 100% of the time, but this is based on very little data. There was not sufficient data for Infant 6.
Conclusion: The data and the MediaPipe Pose images that were collected will be used by researchers to feed machine learning and computer vision algorithms in order to create a monitoring device. Although the main focus of this research was collecting data, much more data will need to be collected in the future for proper machine learning functions. The tables and graphs that were made will also assist researchers in the future who will look at the collected data know what each file contains, and whether or not an infant may display abnormal actions and tendencies.
Reference:
1. United States Environmental Protection Agency. (2019, August). America’s Children and the Environment | Third Edition. United States Environmental Protection Agency. https://www.epa.gov/system/files/documents/2022-04/ace3-neurodevelopmental-updates_0.pdf
2. Ostadabbas, S. (2023). An overview of one of our research at the Augmented Cognition Lab at Northeastern University. YouTube. YouTube. Retrieved July 18, 2023, from https://www.youtube.com/watch?v=_1ZlxC4Q65I.
3. Brighton Center for Pediatric Neurodevelopment. (n.d.). What is Neurodevelopment?. Brighton Center for Pediatric Neurodevelopment. https://www.bcpn.org/what-is-neurodevelopment-.html
4. Villagomez, A. N., Muñoz, F. M., Peterson, R. L., Colbert, A. M., Gladstone, M., MacDonald, B., Wilson, R., Fairlie, L., Gerner, G. J., Patterson, J., Boghossian, N. S., Burton, V. J., Cortés, M., Katikaneni, L. D., Larson, J. C. G., Angulo, A. S., Joshi, J., Nesin, M., Padula, M. A., … Brighton Collaboration Neurodevelopmental Delay Working Group. (2019, December 10). Neurodevelopmental Delay: Case definition & guidelines for data collection, analysis, and presentation of Immunization Safety Data. Vaccine. https://www.ncbi.nlm.nih.gov/pmc/articles/PMC6899448/