Introduction
There are 27 ratified amendments in the U.S. Constitution, 10 of which compose the Bill of Rights. These figures pale in comparison to the more than 11,000 proposed amendments since the Constitution was adopted. We examined an open dataset from the federal National Archives and Records Association that listed each of the proposed amendments as well as a host of other information including who proposed it, what state they were from, and specific to this project, when it was proposed.
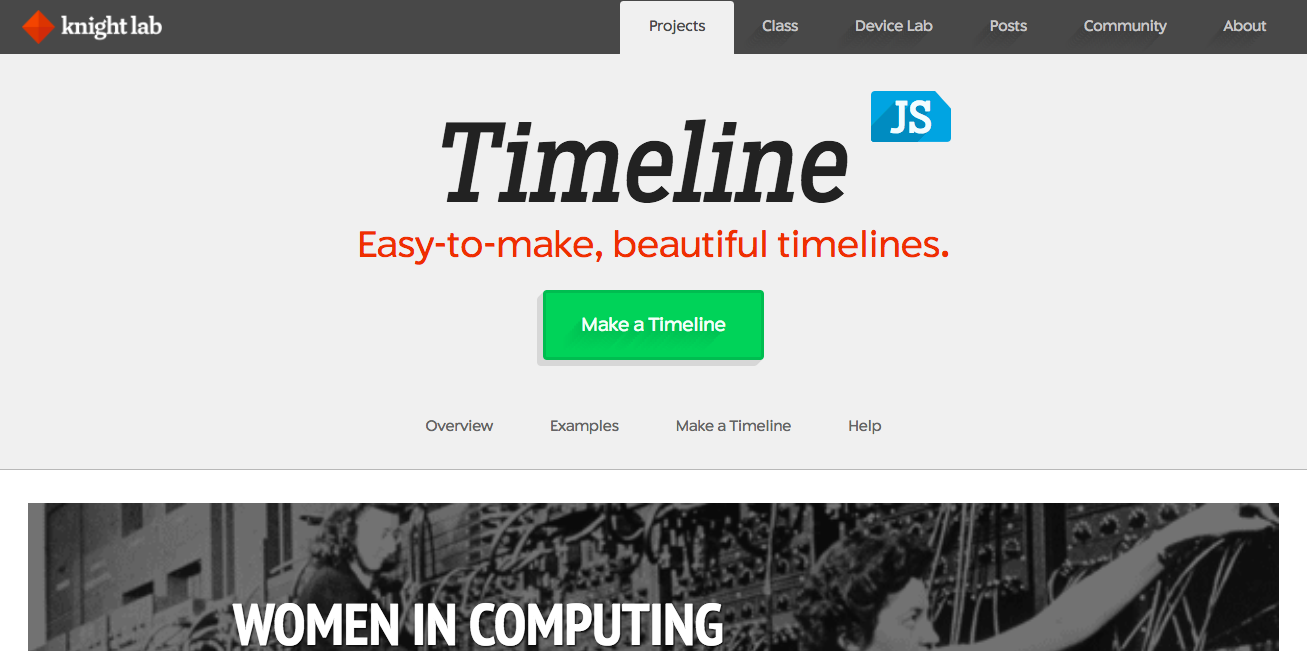
These are tumultuous political times. But we were curious if it’s always been that way. So, using an open source data visualization program, Knight Lab’s TimelineJS, we tracked the number of Constitutional amendments through more than 200 years of America’s history. Knight Lab, an offshoot of Northwestern University’s journalism program, provides a suite of open-source tools for journalists and storytellers of all types.
Clean the data!
Step 1
Our first step in cleaning the data was a four-corners test to understand the bounds and scope of our data. After that, we skimmed the data for empty cells and relative inconsistencies in the data (i.e. a cell in a column is formatted as a currency and the rest of the column is time). Then, we normalized the cell sizes, including unmerging cells, ordering columns, and concatenating dates.
In order to sort the data, the cells must be unmerged and normalized so that the sort function applied to the cells can be understood by the program. This must be done individually by cell; it was time consuming to rectify this but necessary.
Step 2
We then organized some columns on the spreadsheet to be nearby similar data; there was chronological information that was scattered throughout the sheet, for example. We did some manual rearranging of the columns using copy and paste functions. After this was complete, we added a double-header column in order to stay organized, by grouping cells together in subcategories and making it easier to freeze columns as necessary for viewing the data.
Step 3
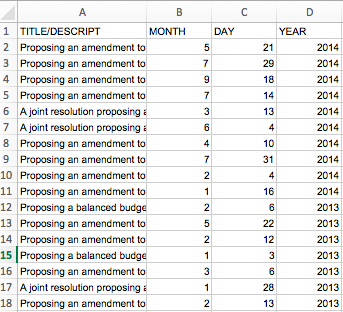
We also used some formulas and sorting to concatenate the date columns. As the data was, the date was split into three columns: day, month, year. We added a column to the right of the last date column, and inserted the following formula:
=(CELL&”/”&CELL&”/”&CELL)
This formula allows you to combine text from a string of columns to produce an output in the last column, and allows you to separate the data with punctuation, spaces or text – whatever you put between the quotation marks.
Drag and drop this formula to the bottom of the spreadsheet; copy the entire column and paste values. Then format the entire column as “date” values. This will allow for much easier sorting and processing if look at sequential information. For a cleaner appearance, we hid the cells containing the string data that we just concatenated.
Step 4
After this was complete, we applied some text wrapping and topical formatting, including adding cell lines and autofitting the height and width of cells to text, to make the sheet easier to read and view as a whole.
Step 5
Finally, we made a pivot table to sort the amendments per year. The TimelineJS site recommends making a timeline with less than 20 slides, and we have almost 250 years worth of data. Thus, we needed to condense the 250 years of data into manageable time periods. We decided to make slides of amendments per decade, as this would create just over 20 slides.
Step 5.1
We copied and pasted the Title of amendment and the date into a clean Excel sheet.
Step 5.2
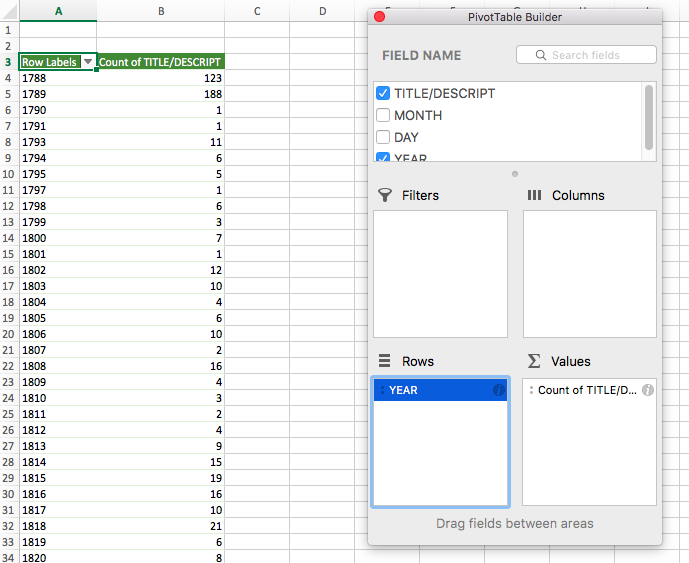
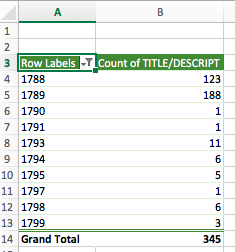
Then we made a pivot table sorting by year and count of amendments proposed.
Step 5.3
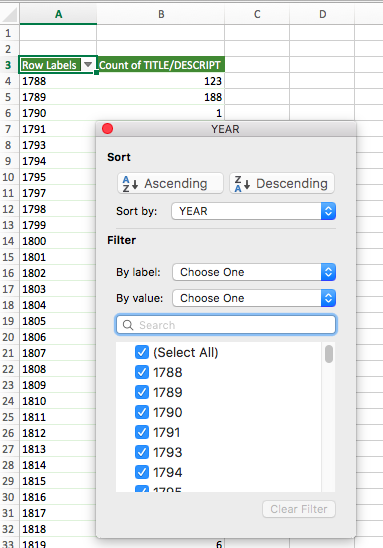
To calculate the number of amendments proposed each decade, we selected the down arrow next to the “Row Labels” column header.
Step 5.4
Then we filtered “By label,” and chose the “Between” option. For the first decade sum, we typed 1788 to 1799. (The first “decade” will actually be 12 years, as the data started on an off year in 1788).
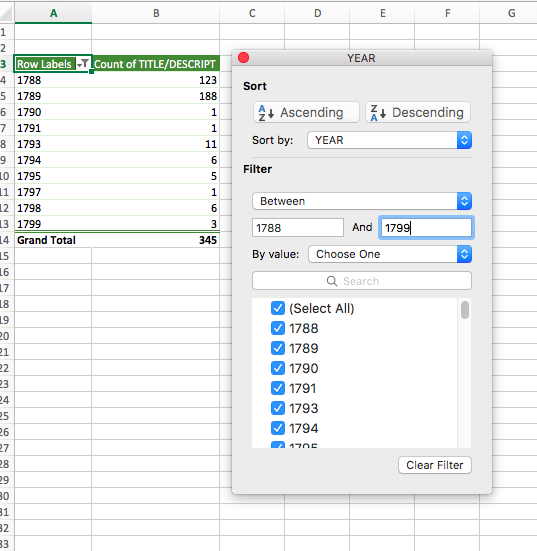
Step 5.5
This tells us that 345 amendments were proposed between 1788-1799.
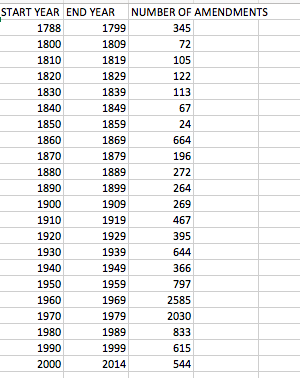
Step 5.6
Repeat for the next 22 decades.
Make the timeline
Step 1
Review yourself with the TimelineJS site. Read through the sections labeled “Overview” and “Examples.” Watch a short Knight Lab video on Vimeo on how to use the program: https://vimeo.com/143407878.
Step 2
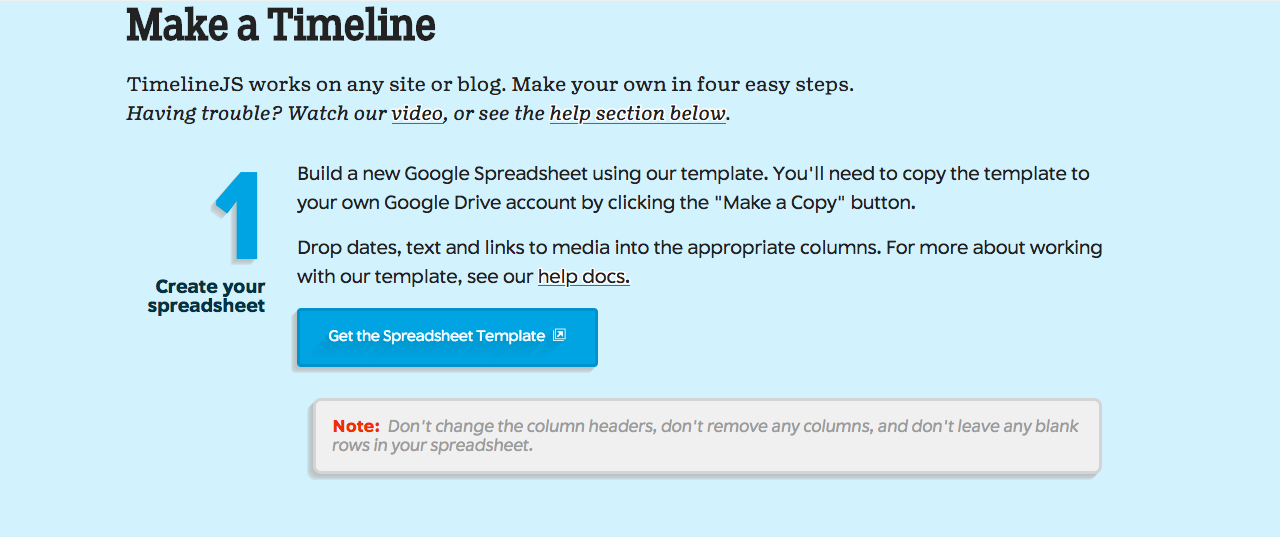
Prepare to import your data. Click on “Make a Timeline,” which will then take you to a blue screen with a step-by-step breakdown of the process.
Click on “Get the Spreadsheet Template,” and then “Make a Copy.”
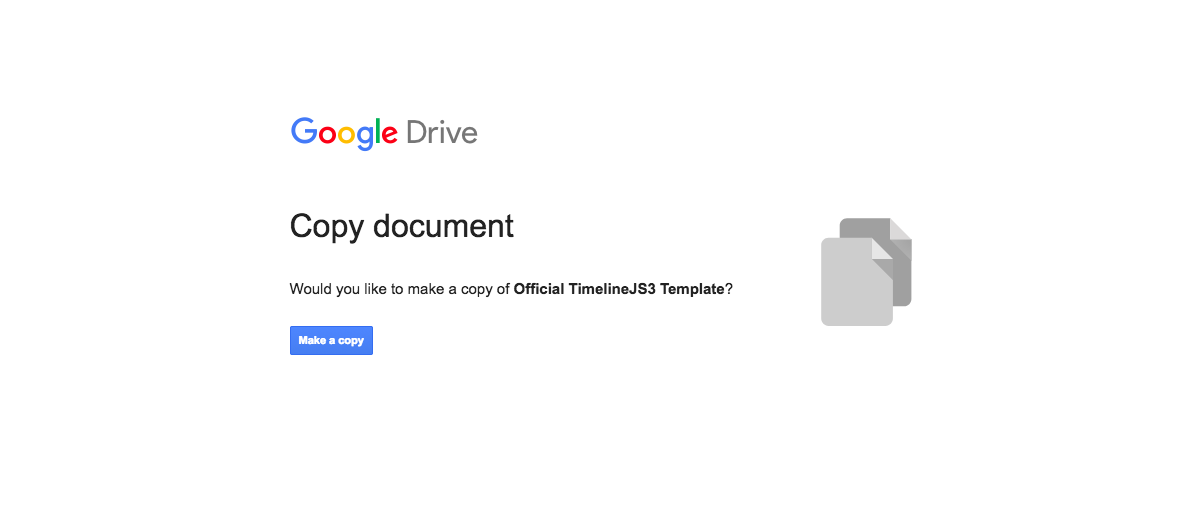
Step 3
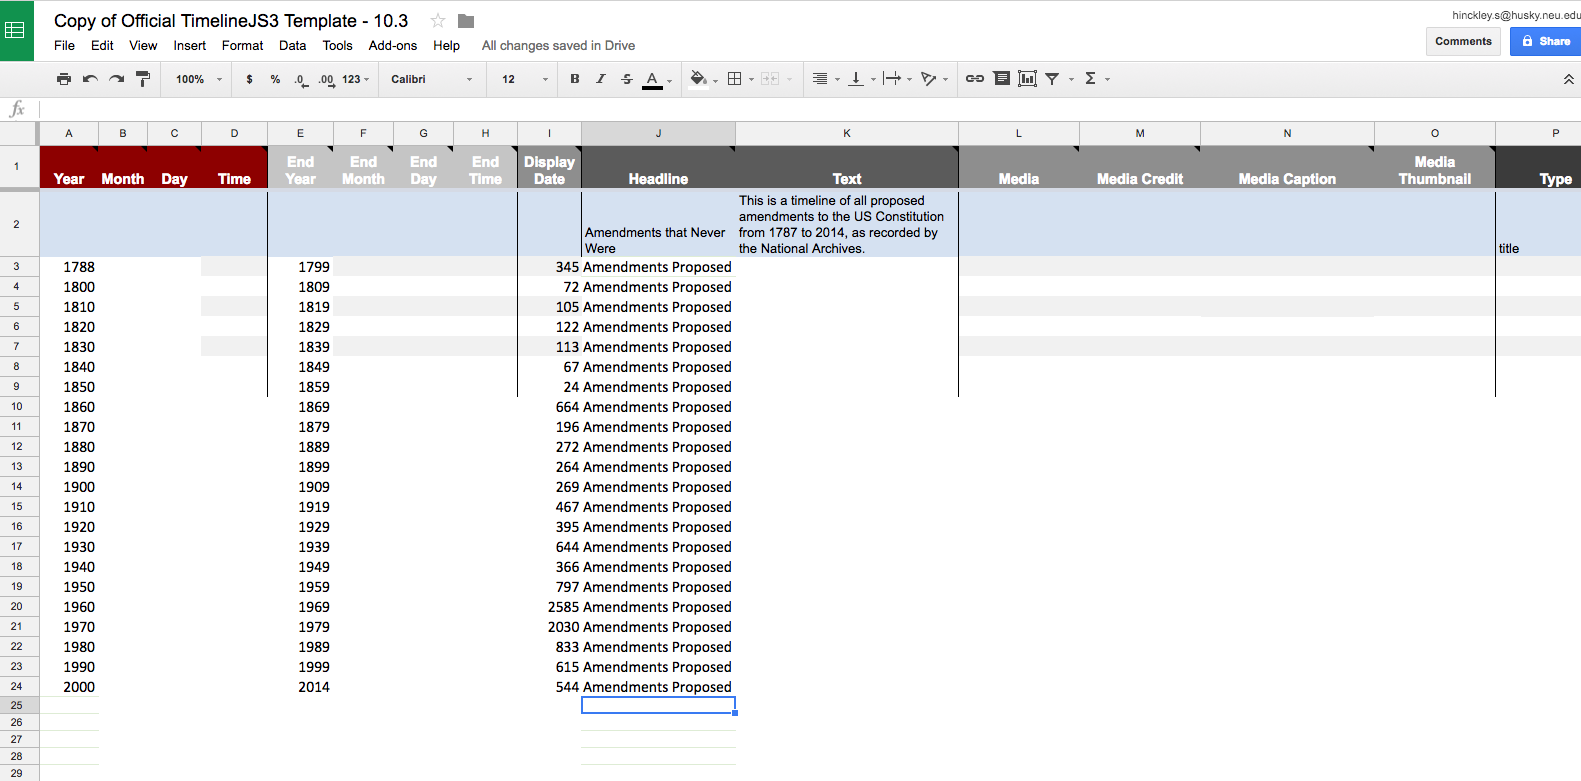
After clicking “Make a Copy,” Google Sheets opens to the official timeline template.
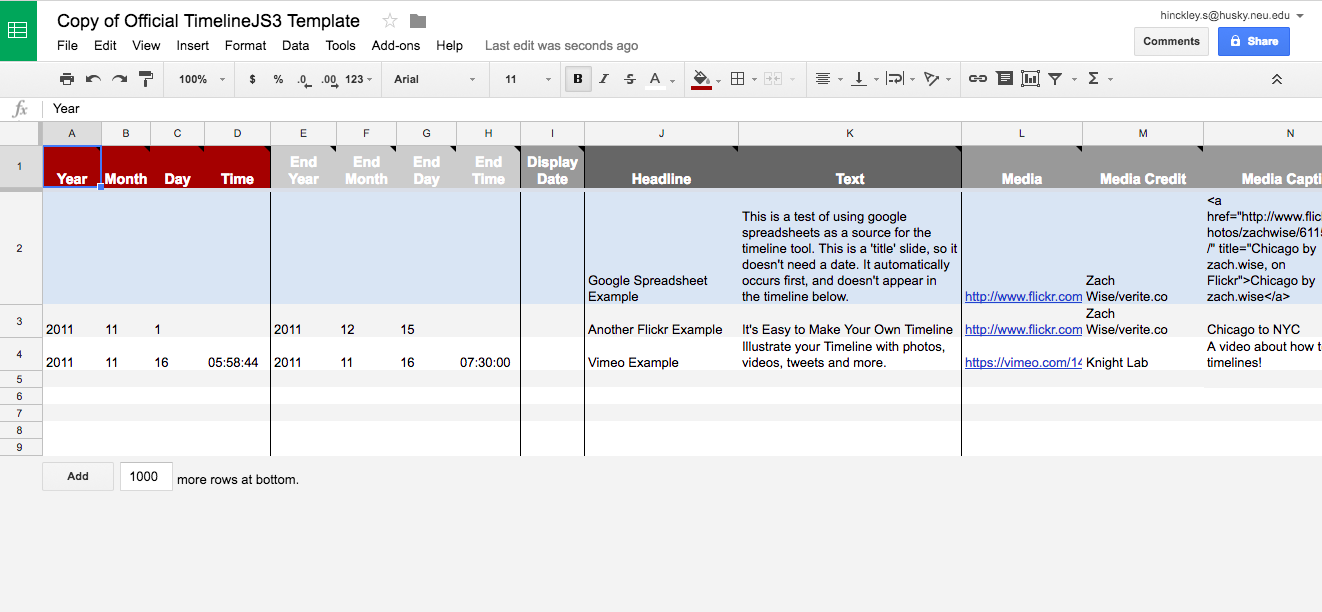
Next, delete the automatic example data.

Step 4
The first row (that is blue) is for the headline and description of your project, and the rest of the gray rows will be the separate timeline slides, one for each decade. (Only fill in start year, end year, and number of amendments proposed under “headline.”)
Step 5
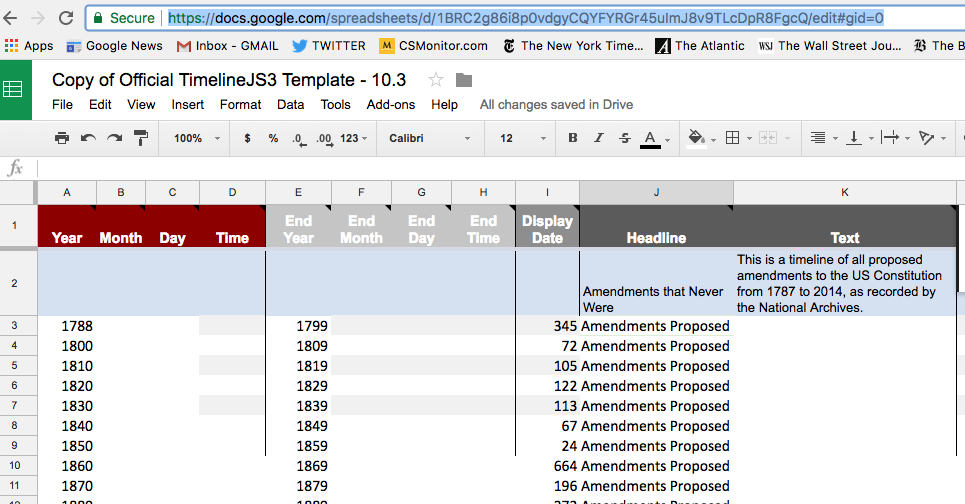
To see what the very basics of your timeline will look like (before adding slide descriptions under the “Text” column or imagest under the “Media” column, etc.), publish the Google spreadsheet to the web.
Click: File → Okay → Publish to Web

Step 6
Then highlight and copy the Google Sheet’s URL.
Paste into the URL link.
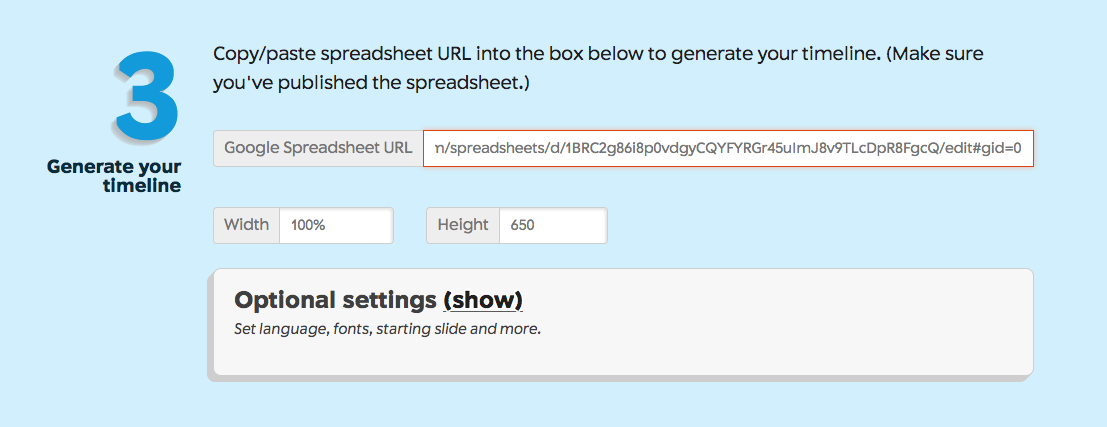
Scroll down and click “Preview” to see a rough draft of your timeline. Come back later to “Optional Settings” to format the font, size, spacing, and overall format of your timeline.

Final Product: A StoryMap of Constitution History