
By Molly Nebiolo, PhD Student in History, Northeastern University
I was able to fly to Canada to immerse myself in digital humanities for five days thanks to a course waiver awarded by DHSI and a NULab Seedling Grant that funded my transportation and housing for the workshop. Not only was I lucky enough to experience the natural beauty that is Victoria, British Columbia, but getting a chance to submerge myself fully into learning something over the course of a week was quite satisfying.
Hundreds of people from all over the world make a pilgrimage to the University of Victoria annually for the Digital Humanities Summer Institute. Part summer camp, part networking opportunity, and part educational experience, DHSI itself has produced an environment where graduate students, undergraduates, professors, and scholars can participate in, learn about, and discuss the digital humanities. While there are two one-week long course opportunities, the mornings, breaks, and evenings are overflowing with opportunities to network, sit in on talks, and participate in presentations. Luckily, there are ample cafes on campus to provide a constant supply of caffeine! I flew into BC early to chair a panel at the first DHSI conference that happened the weekend between Week 1 and Week 2 courses. Not only was I able to practice being a panel chair, I met and listened to a handful of fascinating presenters from both course weeks that I would not have met otherwise. Having also attended the Digital Humanities conference in Mexico City weeks later, I found that DHSI was the laid back and more inclusive counterpart to the DH conference, welcoming newcomers who have varying degrees of knowledge and interest towards the digital humanities.
The course I took was “Stylometry with R—Computer-Assisted Analysis of Literary Texts.” It was taught by Jan Rybicki, the cofounder of Stylo—the R package that allows users to run “simple” algorithms on a corpus of texts with a few clicks of a button. Rybicki’s graduate advisee, Joanna Byszuk, was also a co-lecturer. Over the course of the five days, we learned how to use Stylo in R and how to tackle the program Gephi to produce visualizations of networks and vectors of the corpus we were studying. I used the Women Writers Online corpus for most of my personal work time, but I also created a corpus of Sir Arthur Conan Doyle’s work and Agatha Christie’s work for another part of the course.

Stylometry is a way to compare the similarity of texts in vector space and visualize those connections or changes between authors, over time, or across genres. The algorithms that make up the Stylo package weigh the most used words in each text, then compares those lists across the full corpus. The visual product in R illustrates how closely related these lists of most used words are between texts. For example, for the WWO corpus I used, many of these texts were clustered by author because this tool helps to determine if authors have writing styles across their writing careers, also called stylochronometry, and which authors write similarly to one another (see Figure 1). By transferring the CSV file produced by the Stylo package in R to Gephi, I was able to create better visualizations of the similarities and differences between texts in a corpus. Gephi allows for a sharper vector visualization of the relatedness of texts. Instead of a tree using vertical distance between each point to represent nearness in writing style, Gephi produces a network between the texts. (See Figure 2).
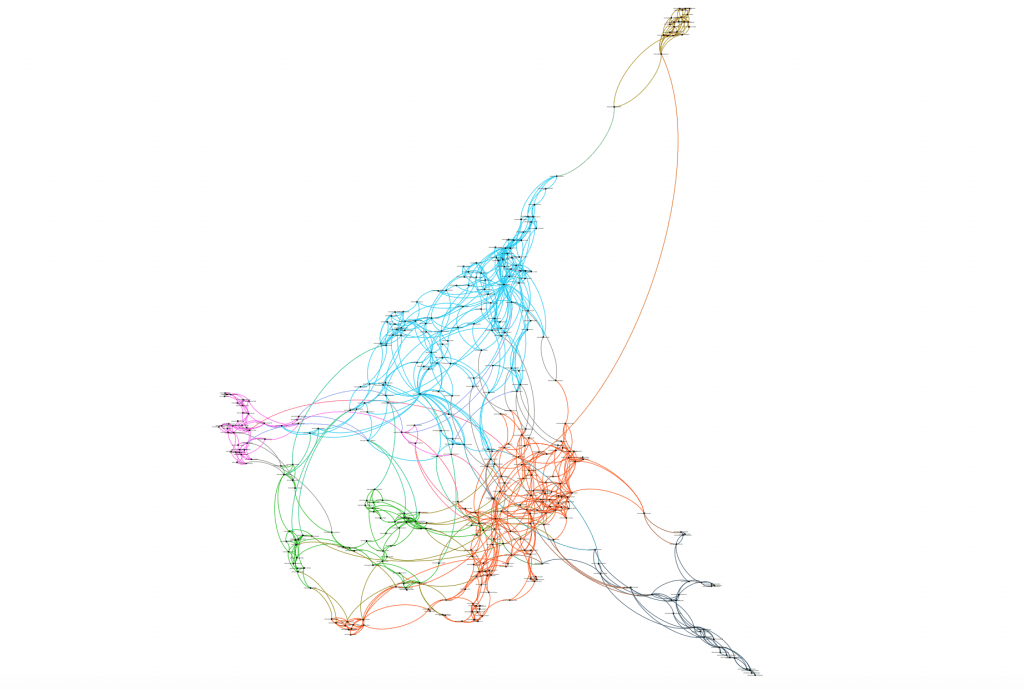
In the first couple days of the course, I became familiar with the Stylo package and Gephi, and got more comfortable with analyzing visuals of textual corpora in vector space. As the week progressed, Jan and Joanna also taught us some of the more stylish things we can do with Stylo and Gephi. One interesting point was how similar the vector images (like that of Figure 2) look to—and possibly even behave like—protein structures. Like an amino acid, each distinct data point (in this case, a piece of literature) is in relationship to every other point. By manipulating the corpus, we can visually produce different outcomes, like dismembering or adjusting the molecular structure of a protein. Another topic we learned in the Stylo class was the methodology behind Stylometry. In particular, we covered Zipf’s law of word frequency: (1) very few words make up a high number of frequency, then a large selection of context words that are much smaller frequency (or inverse frequency), (2) the shorter the words, the higher the frequency of them showing up in a text, and (3) the more frequent the word, the more meaning it has for the author in the text.
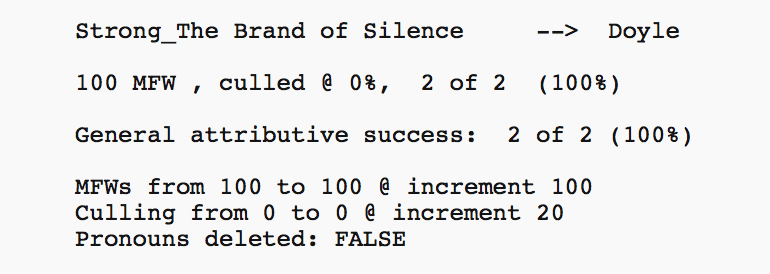
One of the more useful techniques in stylometry that was taught at the end of the course was on Classify and Rolling Classify. Using two corpora of texts, we can compare and determine the relatedness of an anonymous author to potential writers who may be using an alias. For example, I found an anonymously written mystery novel written in the 1920s. This was my secondary corpus. My primary corpus consisted of the Sherlock Holmes series by Doyle, and a couple of mysteries by Agatha Christie based on what TXT files of the two authors’ books were available on Project Gutenberg. The output produces a visual that shows the relatedness of the anonymous text to the contenders. In my example, the unknown text was most like Doyle’s works. I later found out this anonymous author (later determined to be Harrington Strong) was a male mystery novelist, which could be a gendered reason why his writing was most like Doyle’s (see Figure 3).
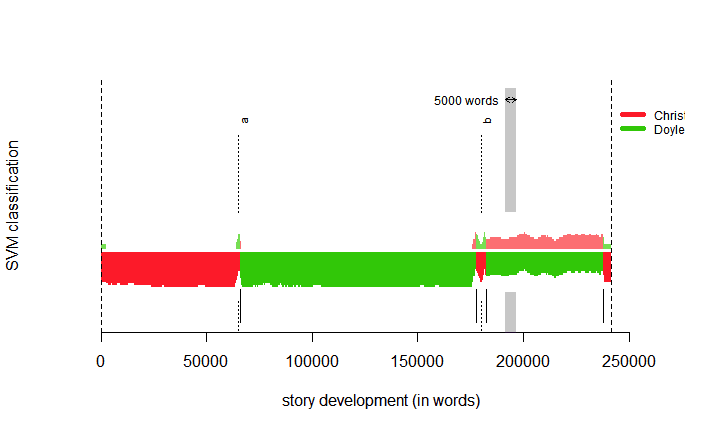
Rolling Classify is an algorithm that allows someone to see the style of how an author writes compared to other writers. Rolling Classify analyzes the text in segments with each segment (usually using a factor of every 100 or 1000-word segments of the text) will be compared with the style of writing in Doyle’s corpus and Christie’s corpus. In Figure 4, we can see the results. The unknown author was most like Doyle overall because his style of writing was most like Doyle’s in most of the text (green), while very few parts of the book were written most like Agatha Christie (red). This last technique in the course seemed most useful, because it can be used to compare the writing styles between authors on a more intimate level than just putting them in vector space. We can dissect a text into segments to make these comparisons. For the Women Writers project, Rolling Classify can provide a more intimate analysis of a text compared to similar authors to determine if this, in fact, is true. Rather than looking at the top ten most used words to create a network of similarity, this process is one that occurs within segments of the text, rather than looking at the text as a whole.
While the Stylometry course was geared heavily towards work being done in the fields of literature and composition, I still found the experience to be really rewarding and useful for the field of history, too. Not only did I make great connections at DHSI when attending the network events and in class, but I also was able to learn a skill that can be useful for the Women Writers Online corpus and potentially for any work I do with intellectual history. I personally find the environment at DHSI to be quite a unique one because we can spend time working on one thing, get away from life distractions to spend time on the University of Victoria’s beautiful campus, and dive into the nitty-gritty of certain tools in the field of digital humanities. With dozens of different course offerings over the course of two weeks, the experience left me in awe of how far the field has come, anxious to go back sometime soon, and enthusiastic to continue working with Stylometry in the future.
For a more detailed read on the skills I learned with Stylometry and the projects I created with the WWO corpus, check out my other post on the Women Writers Project Blog.


