
By Rachel Molko
On October 31st, 2018, the fourth-annual Speed Data-ing event brought together two panels of Digital Humanities and Computational Social Science researchers to discuss a range of research questions, methodologies, and datasets. A diverse array of projects were presented in lightning talks by scholars in the Journalism, English, and Political Science departments as well as the Network Science Institute. The goal was to bring together presenters and audience members who may be interested in collaborating on new research projects in the future.
First up, Costas Panagopoulos from the Political Science department shared a project for the short term in his presentation “Election Outcome Acceptance, Loser’s Consent, and Political Legitimacy in Polarized America: Reactions to the 2018 Election Results.” He is interested in looking at this year’s midterm elections to answer the question: How will Americans react to the outcome(s) of the 2018 elections? Panagopoulos will be examining Twitter data from either side of the aisle to see how discourse changes before and after the results are out, including the evolution of discourse as the newly elected or re-elected candidates begin to take action.
Next, Sarah Shugars from the Network Science Institute shared her research project, “Conversation Dynamic in Online Conversations” to get at the question: What is the core of conversation? The idea is to trace various social media platforms where users go to discuss issues. Shugars considers how these platforms vary and what patterns or trends in discourse are persistent across platforms. Some preliminary work for the project includes identifying the kinds of discourse that takes place on various platforms and determining what aspects of the platforms are influencing how users communicate, theorizing the relationship between the form and content in online communication, and setting up a guide for the affordances of each platform as a site of discourse. An ideal outcome of the project would be to develop a theoretical framework that addresses how one can expect the affordances of a platform to influence conversation and how to go about comparing conversations from platform to platform.
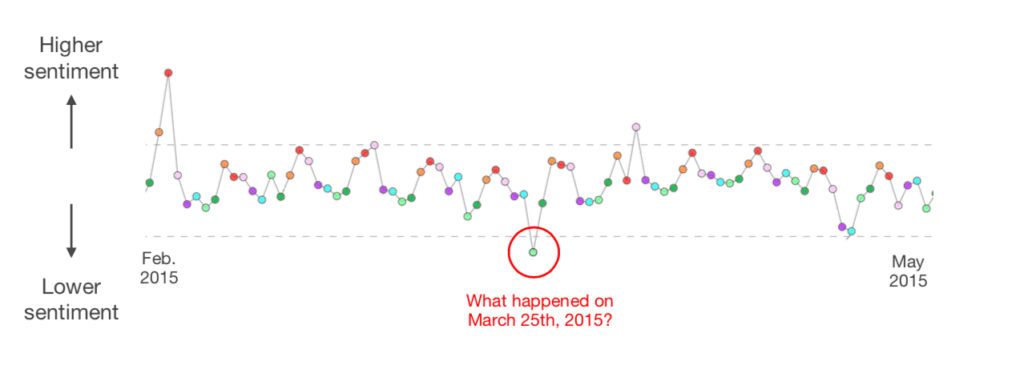
Aleszu Bajak, Graduate Programs Manager in the Journalism Department, was the final presenter on the first panel. His presentation, “Analyzing and Visualizing Elections with Data,” explored visuals for election data such as the net favorability of republican candidates and where women will appear on November ballots. Through R Shiny, he is working on a public facing tool that can be used by newsrooms or other interested groups. The tool functions as a drag-and-drop interface where one can search for terms, pull out sentences, do sentiment analysis, and otherwise give a sense of the data that is collected in the software; Bajak shared versions of the tool that work with both plain text and CSV files.
After a brief Q & A, Stefan McCabe kicked off the second panel by inviting researchers to use a dataset developed in the Lazer Lab over the last five years. This dataset contains 35 million records of 7.2 million donors that have contributed to candidates for federal offices through 2014, totalling 8 GB of CSV data. The type of information contained in the records includes the date of the donation, the amount (generally over 200), the recipient of the donation, and personal information of the donor such as their name, address, and occupation. What makes the dataset especially valuable is the unique identifier assigned to each donor, illustrating the various donations made by the same individual over the years. Stefan shared that the dataset may be used for macro-level analysis in order to look at the cities where the most donations come from, or micro-level analysis to look at donations from different neighborhoods in the same city. The database currently resides in the Harvard dataverse (doi: 10.7910/DVN/BQN6XE), and will eventually be updated to reflect information up to the present election year.
Next, Cara Marta Messina discussed fan uptake using Archive of Our Own (AO3). Using methods from fan studies, rhetorical genre studies, and computational text analysis, Cara asks: What are some fan uptakes of the 2012–2014 television series Legend of Korra? How do fans define their practices? In what ways do fans challenge normalized narratives around sexuality, gender, race, and different abilities? In Rhetorical Genre Studies, uptakes are the appropriate responses in particular contexts that have been deemed appropriate based on place, time, frame, and function. Cara presented on a few ways to trace fan uptakes such as searching what “relationship” tag authors select and comparing those to romantic events on the show, comparing different computational text analysis results across time, comparing different computational text analysis results across the “Rating tag,” and conducting personal interviews with fanfiction writers then showing them the results of the AO3 analysis. Cara intends to use the latter to guide her dissertation project.
Finally, Ryan Gallagher presented “Word Shift: A General Method for Visualizing and Explaining Pairwise Comparisons Between Texts.” Word shift graphs are a general tool for visualizing differences in sentiment between texts, taking into account changes in each word’s relative frequency, changes in each word’s relative score, and differences in each word’s score across texts. The vertical bar charts help visualize differences in how words are used by quantifying which words contribute to a pairwise difference between two texts. Ryan created a generator for word shift graphs called Shifterator, a Python code; Shifterator can be found on github.com/ryanjgallagher/shifterator. In order to generate a word shift graph for your data, you will need to count the words and load the score dictionary for your data. Currently, Ryan is looking for suggestions of case studies that would help demonstrate the utility of word shift graphs to a wide variety of scholars who work with text data.
If you’re interested in learning more about these projects or in becoming involved with collaborative research at the NULab, please reach out to Sarah Connell at sa.connell@northeastern.edu.


