By Hanyu Chwe
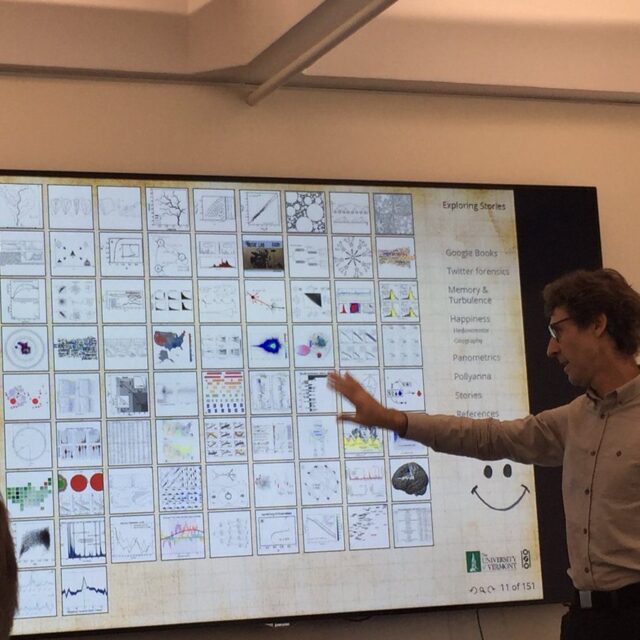
Professor Peter Dodds directs the University of Vermont’s Complex Systems Center and co-directs the Computational Story Lab. Here’s a small overview of his presentation at the Network Science Institute on October 19th.
One of Professor Dodds’ largest sentiment analysis projects measures a population’s happiness by assigning a happiness value to each word written on Twitter. For example, the word “love” has an 8.3 happiness rating, but “hate” gets only a 2.3. By measuring the average score across a sample of all tweets, the “Hedonometer”—as Professor Dodds calls this tool—can produce a rough estimate of how happy the Twitterverse is at any given moment. For example, Christmas Day was a happy time for Twitter (average word score was 6.25 with popular words like “merry” and “happy”) but the day of the Las Vegas shooting was much more negative (5.77 rating because of negative words like “shooting”, “gun”, or “victim”).
With this metric of human happiness, Professor Dodds and his co-workers can explore population happiness across time, geography, and demography. For example, Saturdays tend to be the happiest day of the week, but Tuesdays are the saddest. Hawaii is the happiest state in the Union, while Mississippi and Louisiana are the most gloomy. Of course, not everyone uses Twitter, and even a Twitter user doesn’t spill out their innermost emotions every day. Regardless, the Hedonometer is a useful tool to measure general population happiness.
The same metric can be assigned to traditional texts, not just social media output. Professor Dodds has used the hedonometer to trace emotional trajectories through the narrative arcs of stories. For example, some stories are mostly positive in the beginning, are more negative in the middle, and finish with a happy ending. Professor Dodds can trace those narrative trajectories with the Hedonometer; when many happy words are used, that implies a happy part of the story.
Across hundreds of stories, Dodds and his co-authors found that most stories fall into one of six archetypical sentimental trajectories. For example, the example mentioned above (rise-fall-rise) would be a “Cinderella” story. A “rags to riches” story would start off unhappy and rise to happiness. Almost all the written stories analyzed by Dodds and his team fall into these basic archetypes.
Finally, sentiment analysis isn’t limited to just human emotion: the “Lexicalorimeter” measures the “caloric content” of social media messages. Professor Dodds and his team can assign caloric values to words and use them to describe different populations’ health habits. For example, if North Dakotans are likelier to use the word “pizza” or “fried” on Twitter than South Dakotans, that might reflect different eating habits between the two Dakotas. If Californians are likelier to use the word “hike” or “dance”, they might also be likelier to exercise than a state which mostly talks about “eating” or “watching TV”. It may seem like a stretch, but the Lexicalorimeter tracks quite well with traditional health measures like diabetes rates.
Dodds touched on many other topics: the evolution of the English lexicon, positivity bias in English and other languages, lexical turbulence on Twitter, and flaws in the Google Books corpus. For more about his research, visit his website. For more about NULab and Network Science Institute events, be sure to visit both organizations’ event pages, listed here and here.


