Designing For Persuasion
Rhetoric in Information Design to Communicate on Social Problems
Design has been used as a representational medium to address social problems due to its persuasive impact. Designers have directly influenced the actions of individuals and communities, changed attitudes and values, and shaped society in surprisingly fundamental ways (Buchanan 1985). Rhetorical techniques are employed in the design process to achieve persuasion. Graphic design, industrial design, interaction design, and environmental design all accomplish persuasion to some extent. Information design specifically, with its features of data-based facts and visual-oriented presentation, can also leverage its persuasive power to address social problems.
The values that distinguish information design from other kinds of design are efficiency and effectiveness at accomplishing the communicative purpose
(Jacobson 2000, 16). Through a systematic
arrangement, information design manages the complexity of information overload in our modern society.
Meanwhile, it also reveals the information in a neutral and transparent manner that does not obscure
audiences’ reading. Apart from providing the audience with an opportunity to be exposed to complex
data and social facts, it also focuses on more comprehensive visual forms to represent the data.
This increases the understanding of those participating in a specific conversation or discourse
(Jacobson 2000, 4) to devise a better persuasive message-delivering process.
| Designer | Yuan Hua |
|---|---|
| Keywords | information design, persuasion, rhetoric, social problems, recycling contamination |
| Advisor | Thomas Starr |
| More Info | Yuan's Portfolio |

Conceptual Frameworks
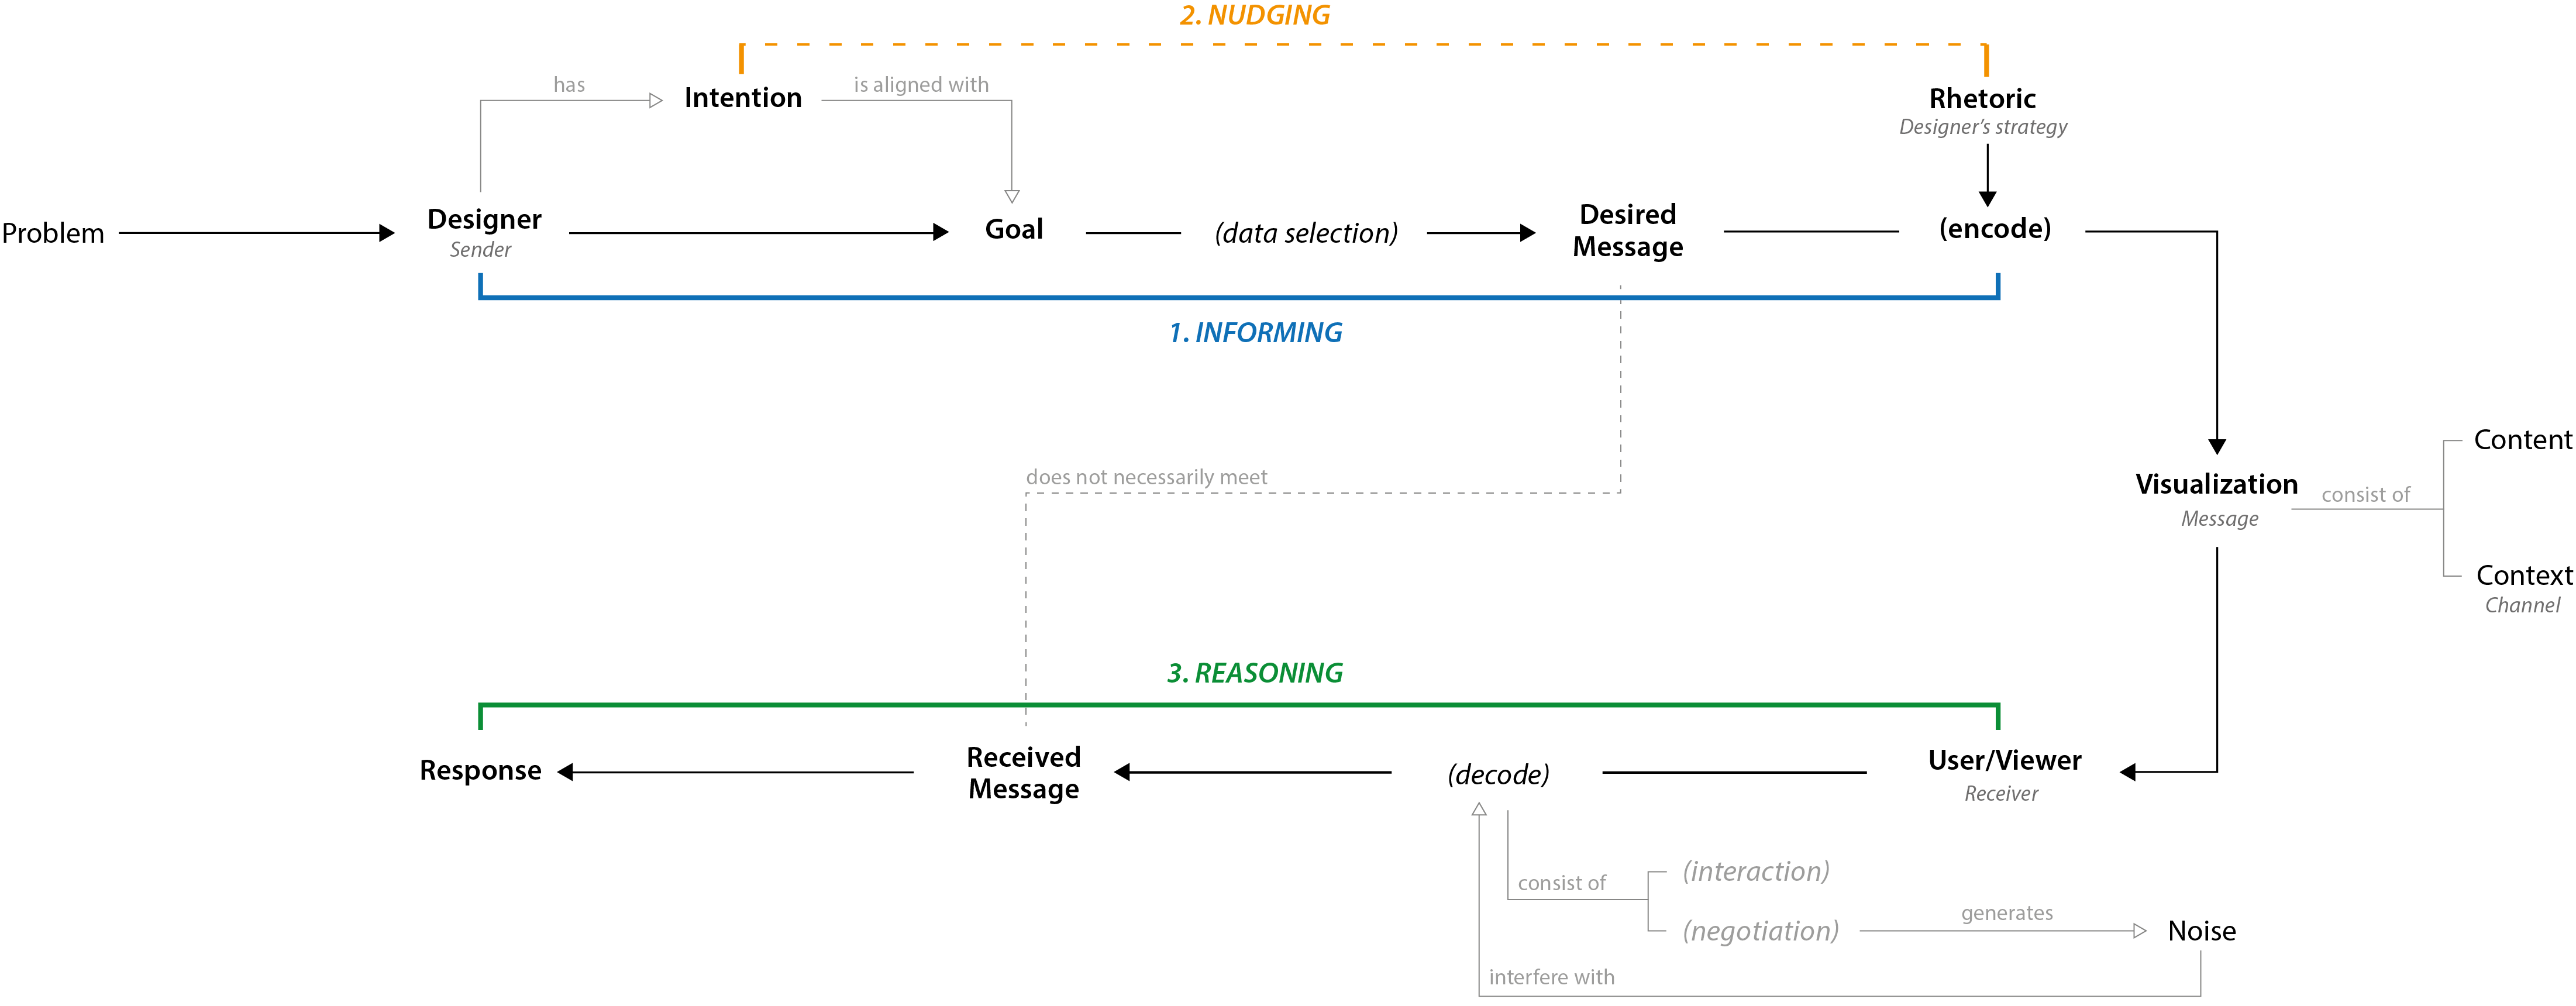
This thesis emphasizes the cognitive changes that information design can bring to people about social problems through persuasion. It attempts to perform an analysis of information design centering on persuasion. First, it proposes a theoretical framework that first modeling the relationships among information artifacts, audiences, and designers from a communicative perspective; then articulating the persuasive stages of information design — informing, nudging, and reasoning.
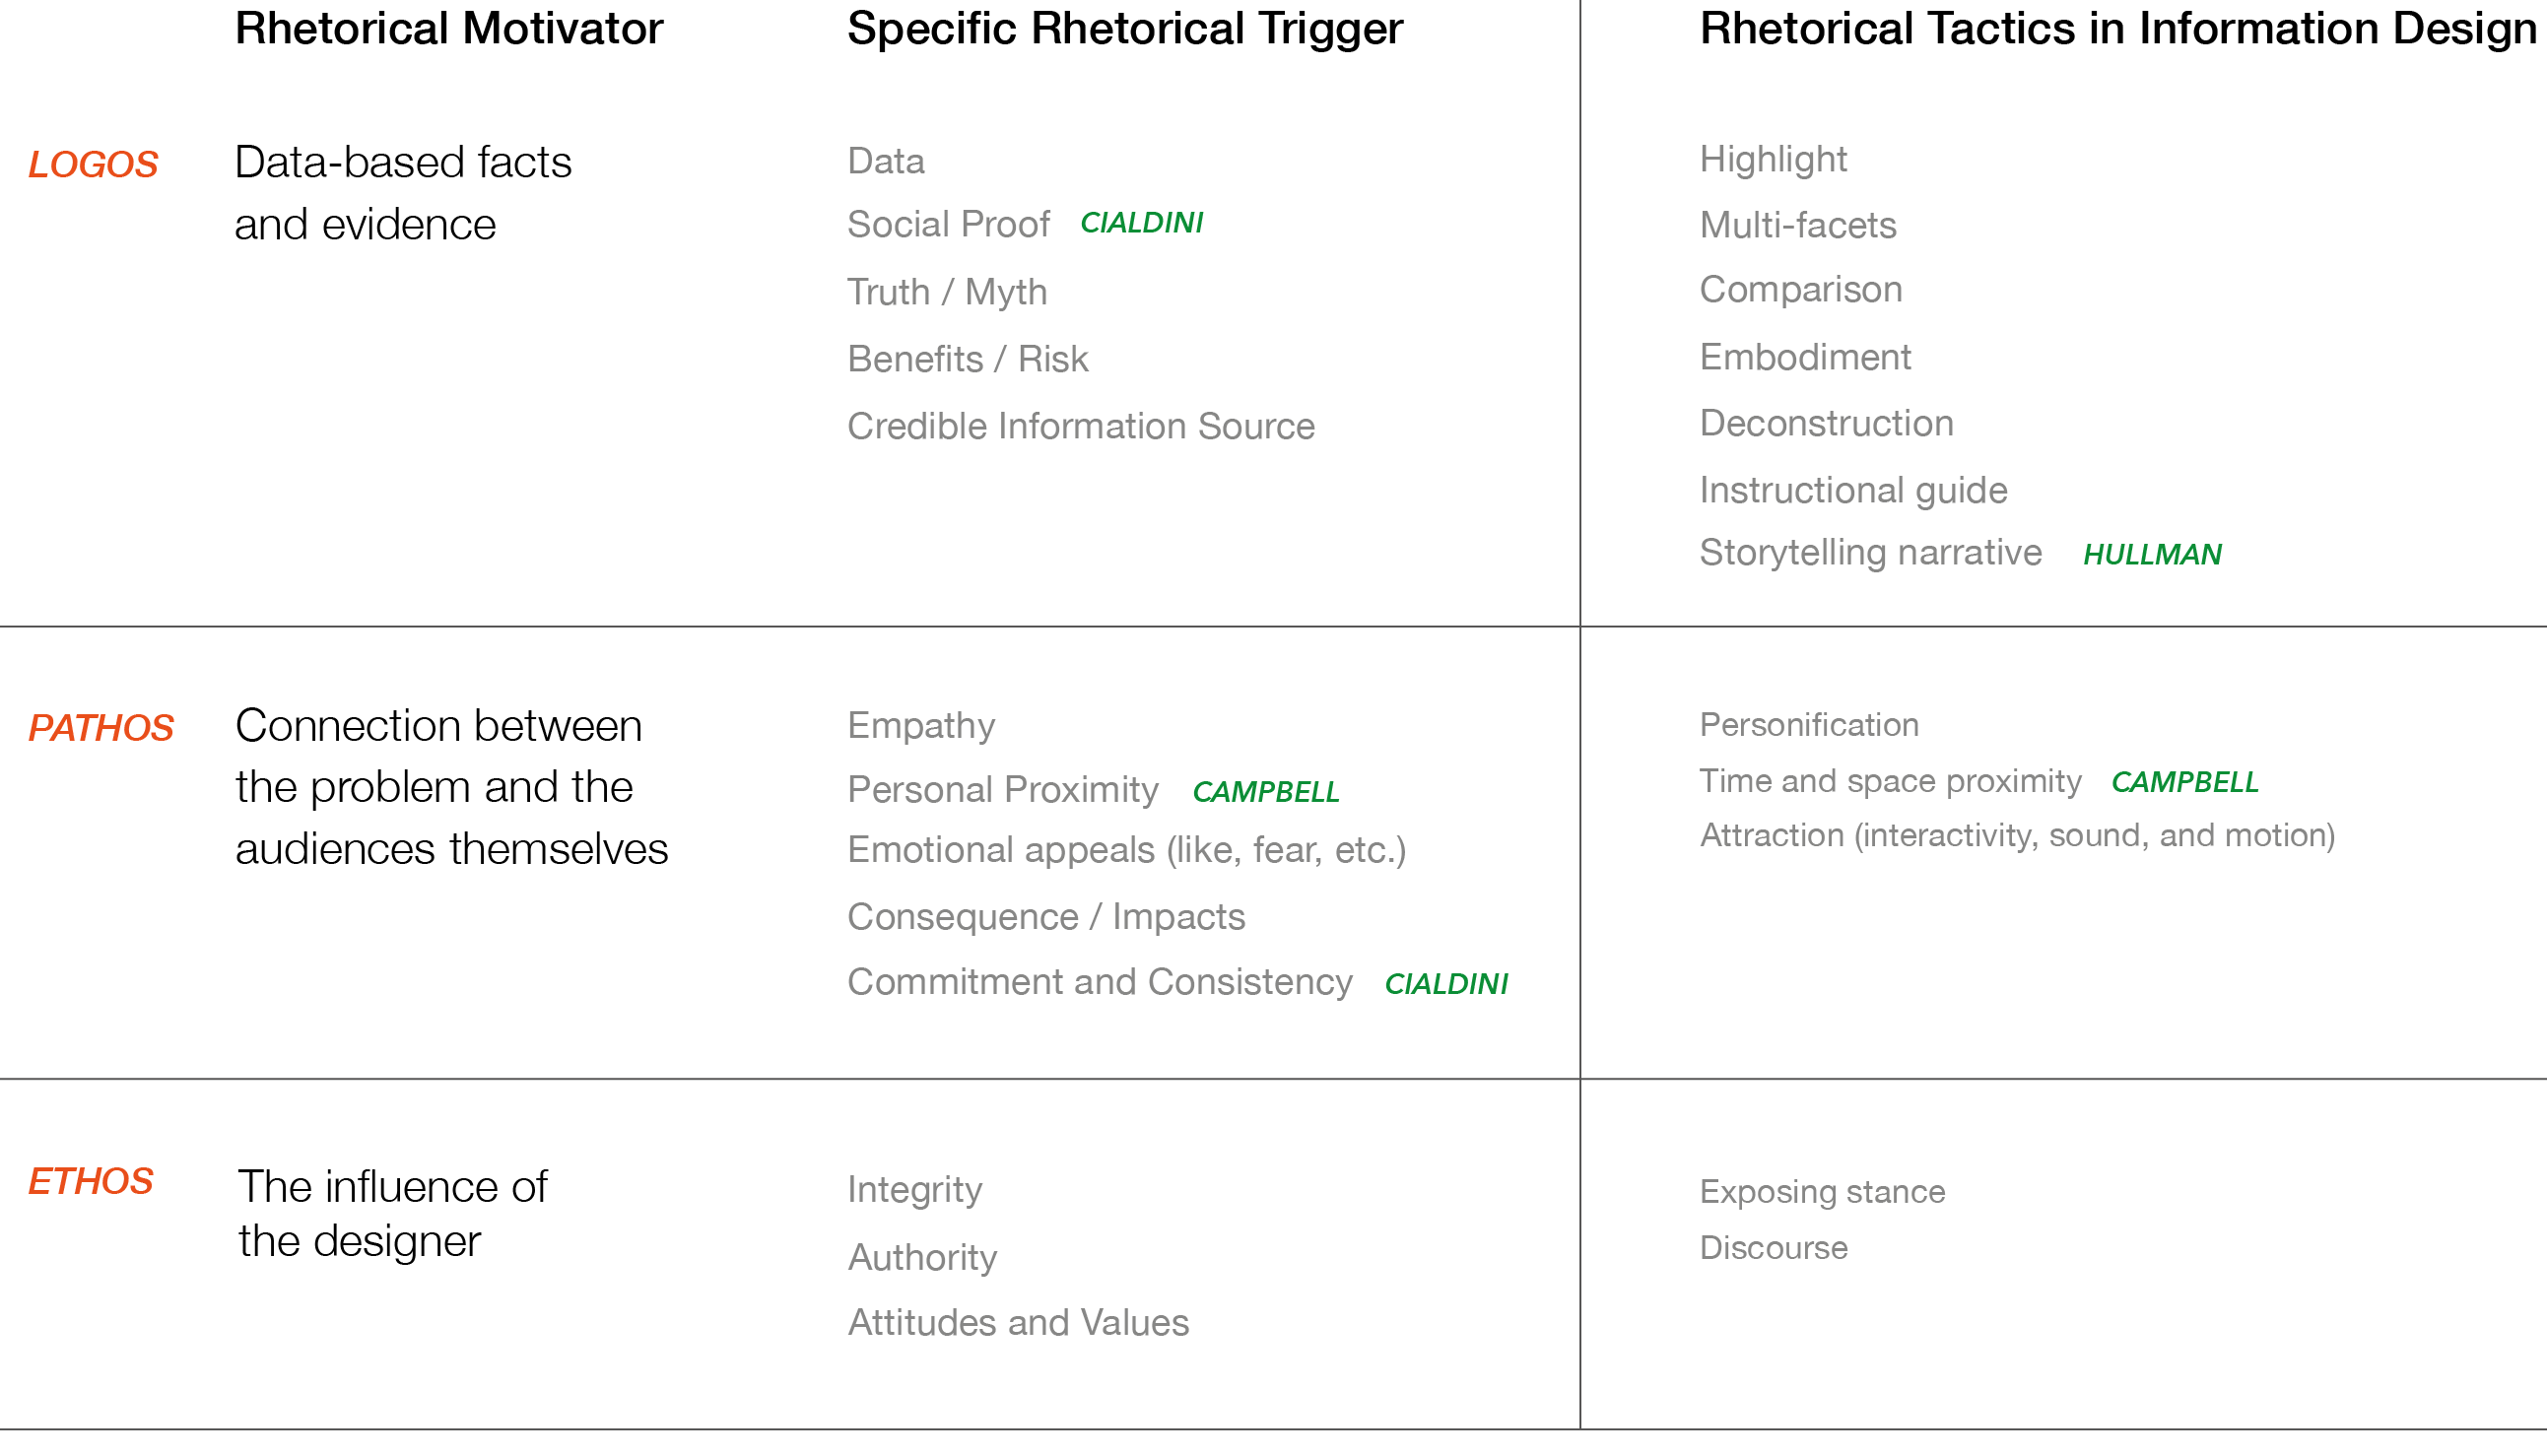
Additionally, this thesis addresses the rhetorical aspect of information design by discussing the relationship of design and rhetoric, exploring the concepts and practices from existing rhetorical studies, and presenting the rhetorical taxonomy for information design. This taxonomy includes the rhetorical motivators and tactics I conclude and suggest for this domain.
Practical Projects
Finally, to explore the practical use of rhetoric in information design applied to a social issue, I launch a case study by addressing the social topic of recycling contamination. Through implementing two design experiments with different rhetorical motivators and tactics, this practical project aims to (1) engage people in the issue of recycling contamination and (2) persuade people to take the initiative to recycle correctly thus avoiding contamination and (3) test the effectiveness of the rhetorical tactics in terms of persuasion by collecting people’s response to the design pieces. I connect the theoretical and the practical part of my thesis and present both in this exhibition.
EXPERIMENT 1
ANATOMY OF RECYCLING BIN
The insides of curbside recycling bins are often hidden from the public. People only hear about the feel-good aspects of recycling and zero waste, and rarely do they hear about the other side — the inefficiency of recycling.
By making the casing of the bins transparent, this experiment uncovers the messy inside of recycling bins. On one hand, it reveals the current recycling contamination problem by displaying the ideal bin that people usually imagine and the actual bin we have at the curbside. On the other hand, through the comparison between different items and states in two control bins, this experiment physicalizes the information to build a conversation with the audience, evoking them to conduct a self-reflection on their own recycling behavior.
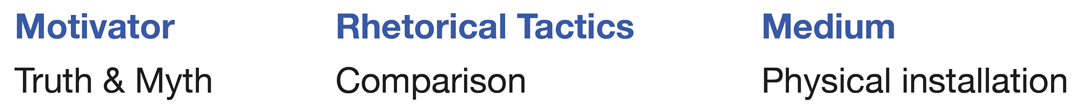
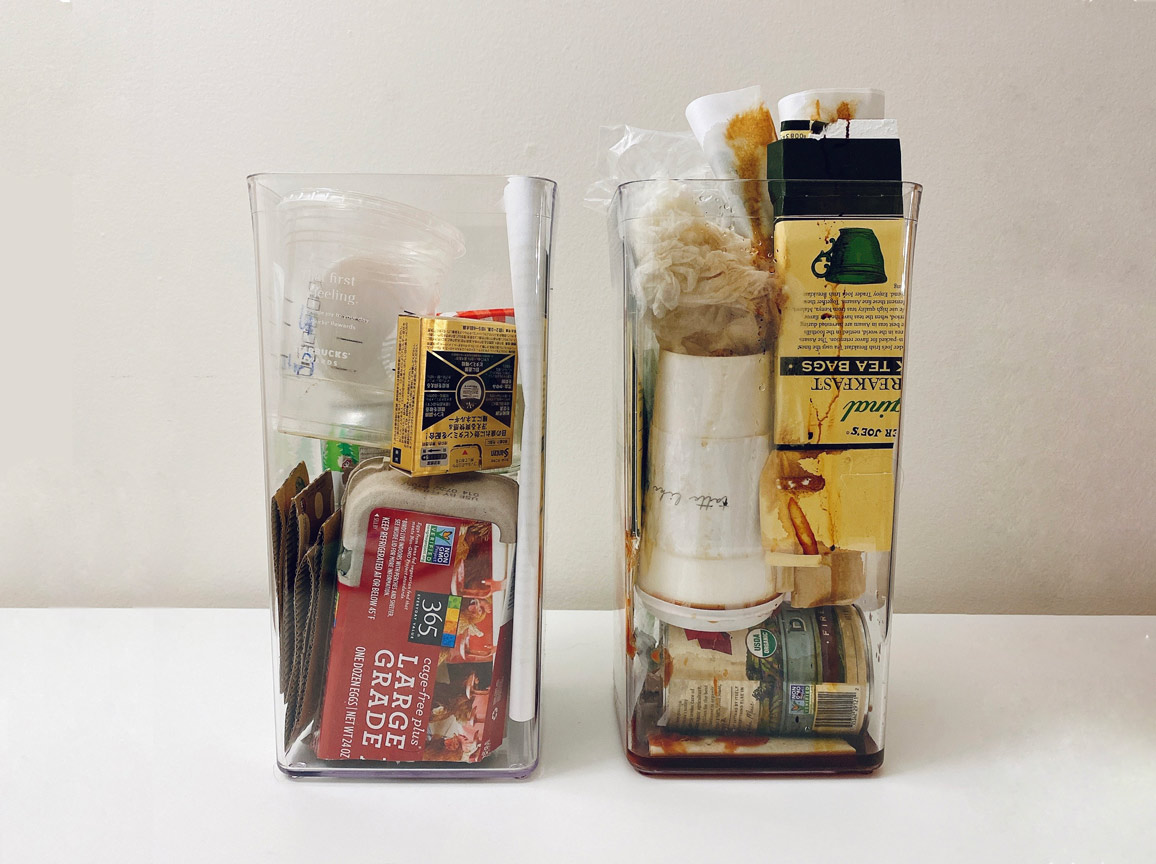

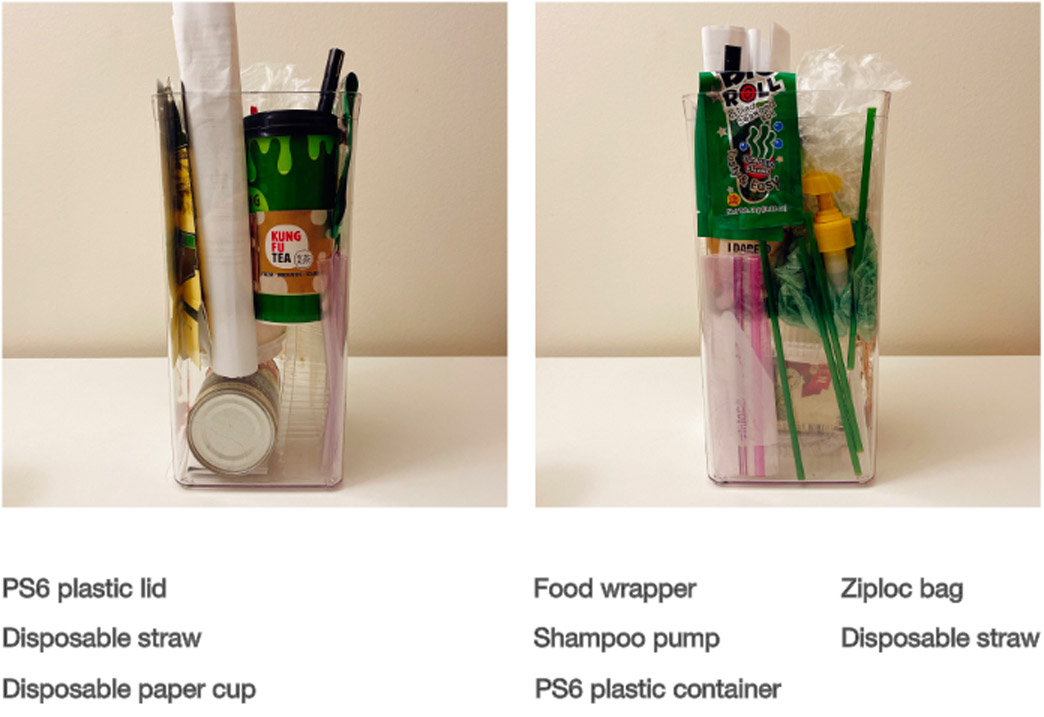
Comparison
By revealing the covered truth inside the recycling bin, I hope the audience can directly feel the contrast between the left bin (aspirational recycling bin) and the right bin (actual recycling bin). To evoke a self-reflection about if they are making such mistakes and if they are recycling in the correct way.
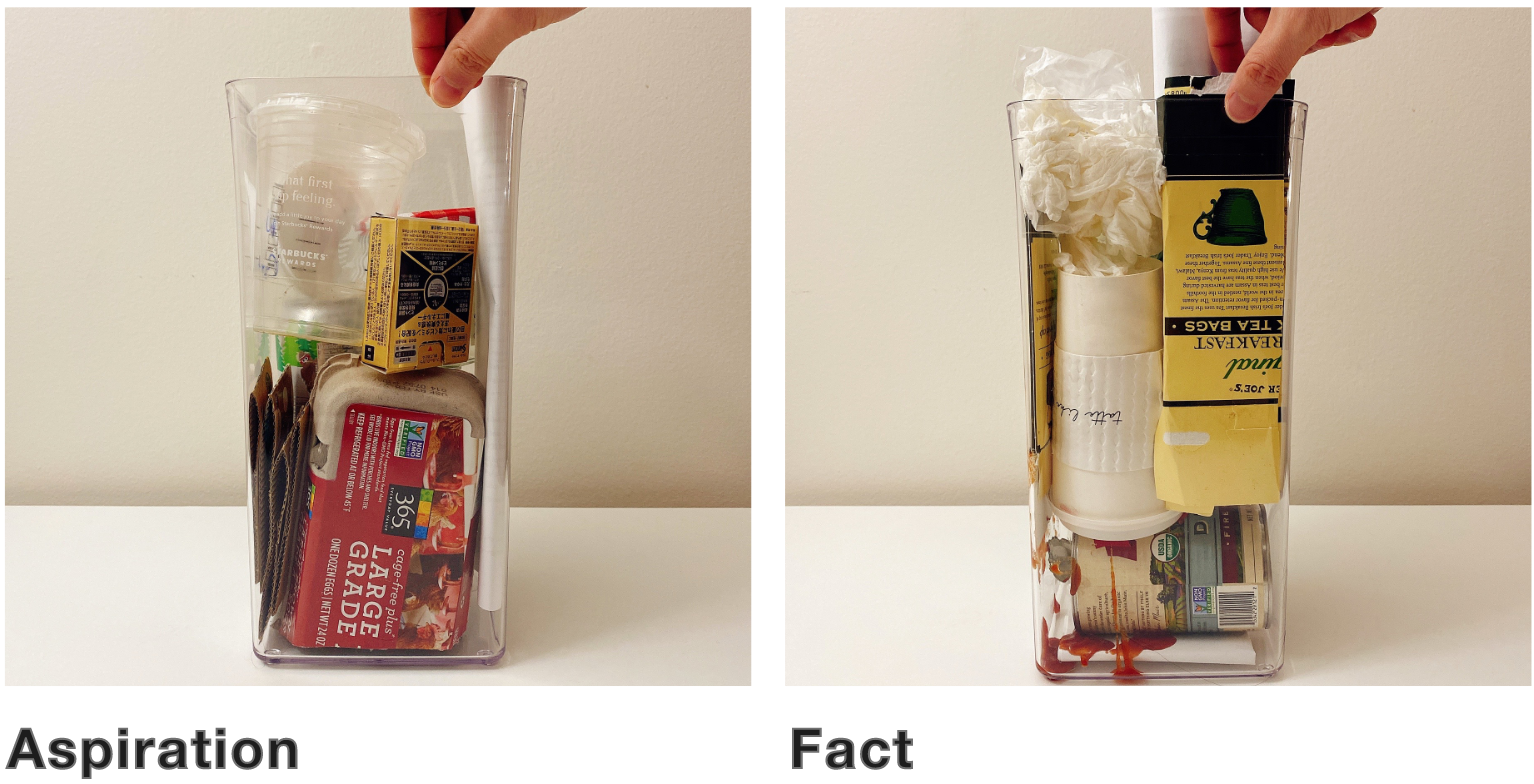
Aspiration — Clean Recycling Bin
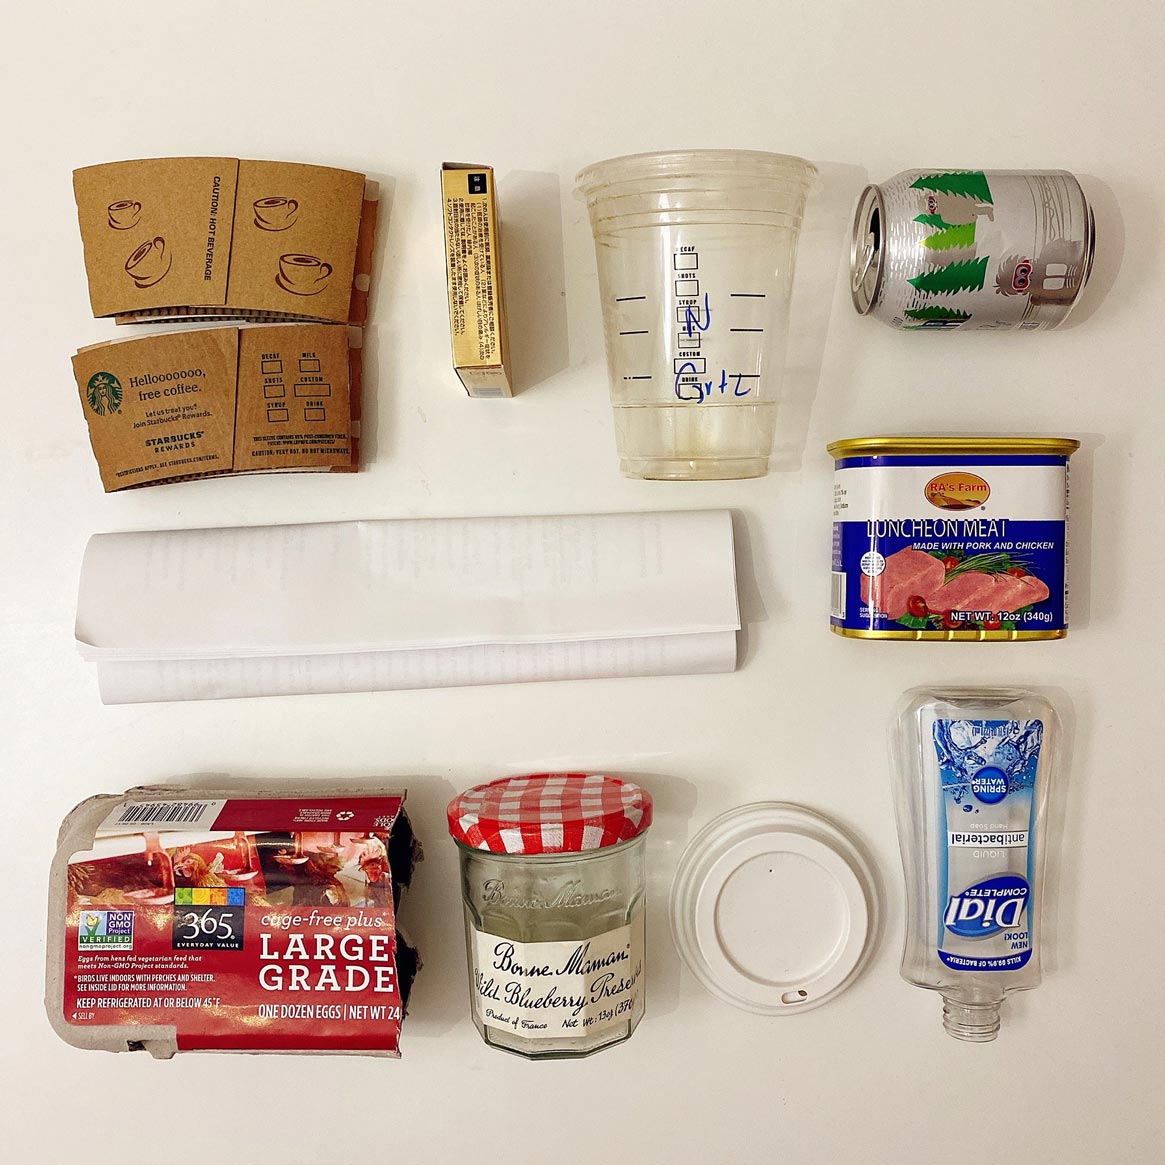
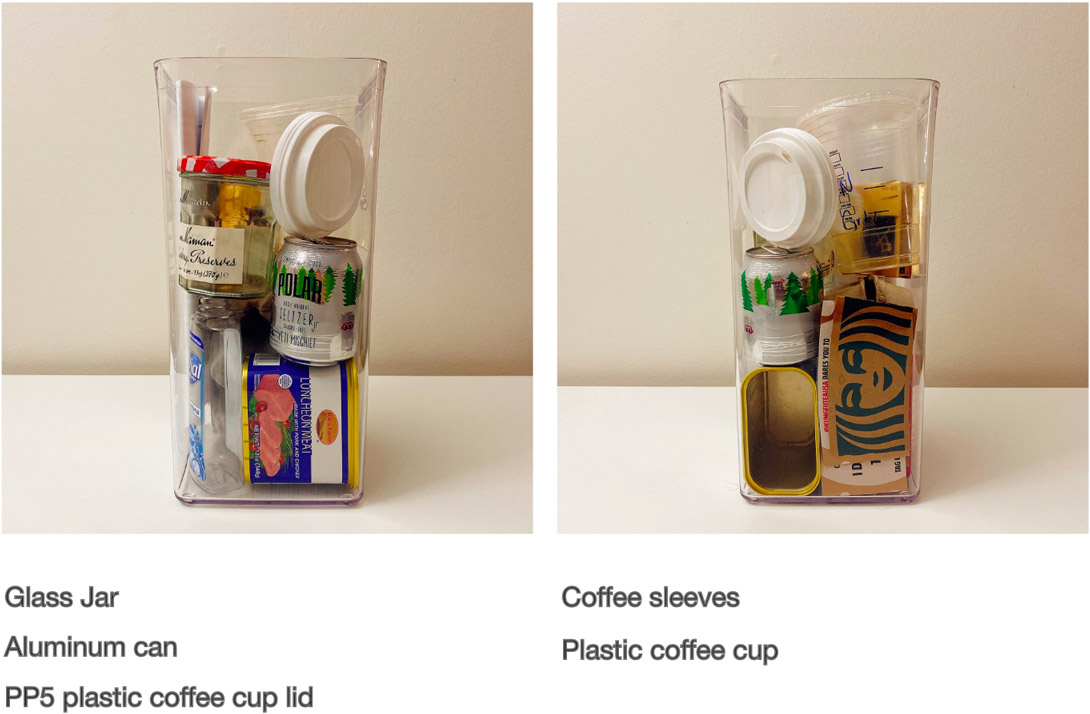
The aspirational recycling bin includes all the correct and clean recyclables based on five common sorting groups: Glass (glass jar), Plastic (plastic coffee cup, plastic coffee lid), Metal (soda can, spam can), Paper (clean paper) and Cardboard (coffee sleeves, egg carton).

Deconstruction
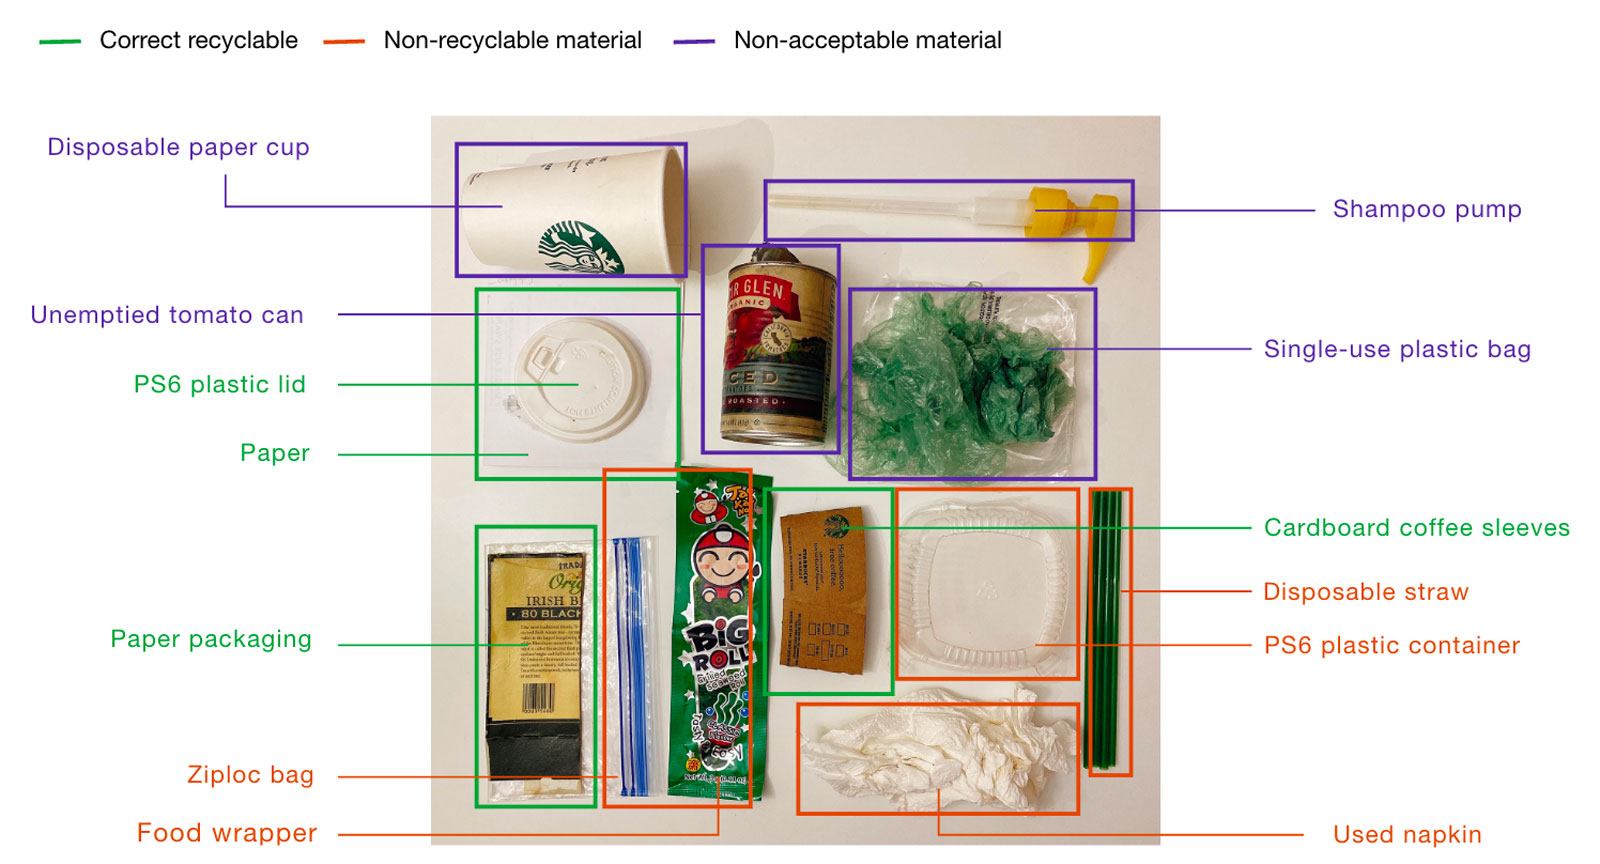
The actual recycling bin includes three types of materials: Correct recyclables / Usable materials,
Contaminant type I (non-recyclables / trash) , and
Contaminant type II (non-acceptable materials) .

Recycling Bin in Transportation
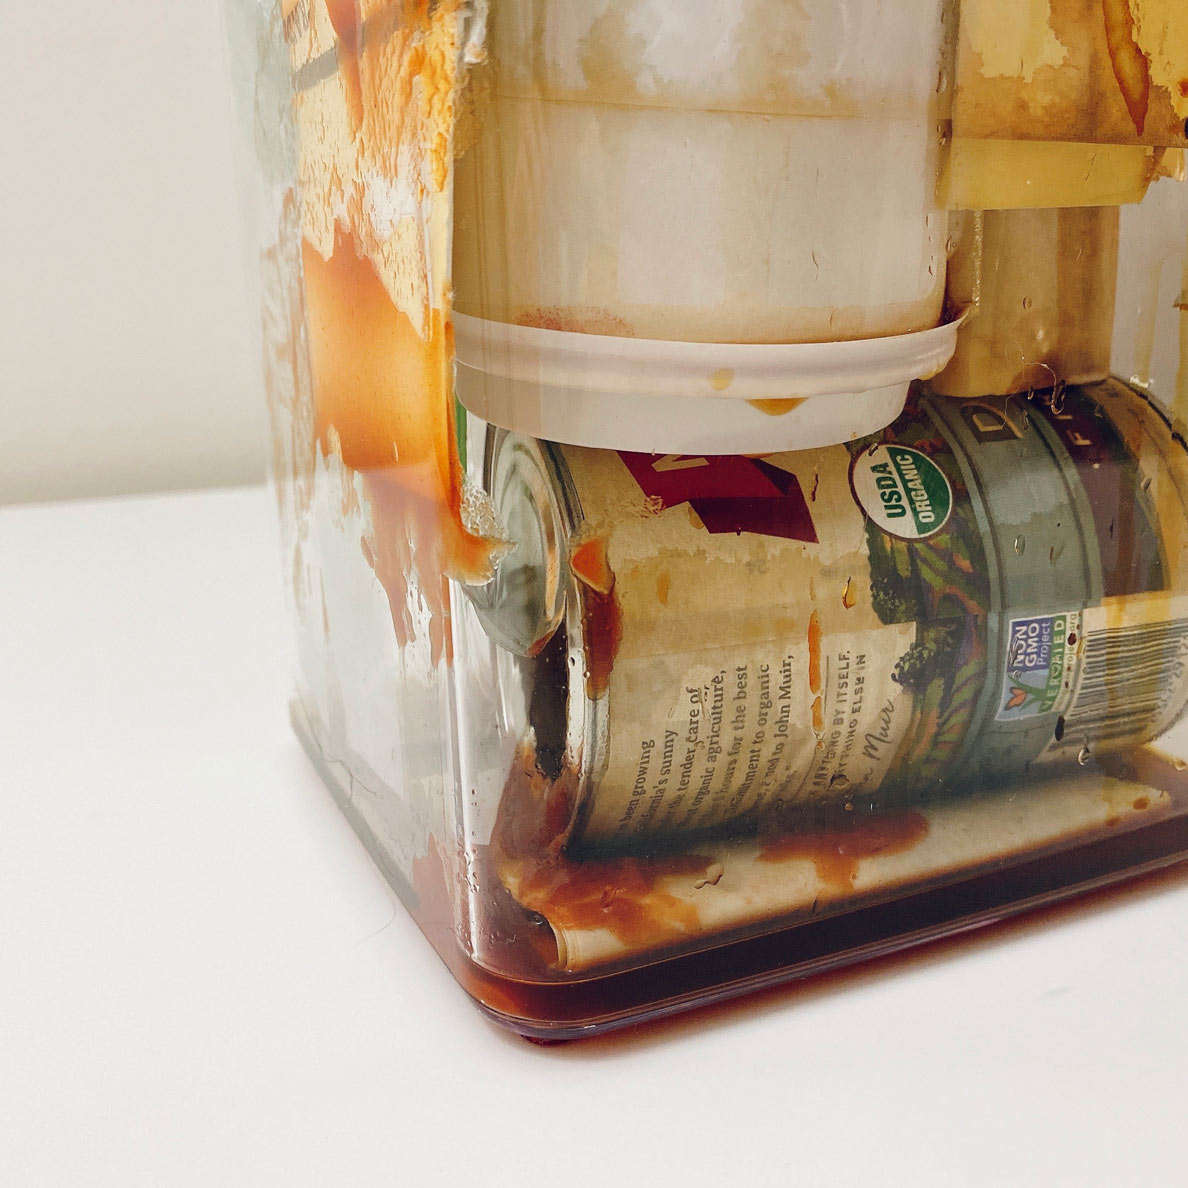
The recycling bins are picked up curbside by haulers and transported to the Material Recovery Facilities (MRFs). This animation simulates how the inside of contaminated recycling bin look like during the transportation process. Coffee and diced tomato left in the container are the chief criminals to contaminate recyclable paper and cardboard, making them into trash. They also mess up the entire recycling bin, making the pick-up and sorting process harder for the workers.
EXPERIMENT 2
REVEALING RECYCLING CONTAMINATION
This experiment aims to create an informative while edifying design artifact to expose people to the recycling contamination issue. By presenting all the information in a booklet, this project tries to build a storyline which explains the problem comprehensively and proceeds in an orderly way, so as to better lead the audience to the topic.
The booklet combines infographics and text to build the story. Different rhetoric motivators and tactics are used in the storyline and graphics to articulate the contamination problem from different perspectives.After I finish designing the booklet, I will conduct a survey and have several interviews to test the effectiveness and persuasiveness of the tactics I used in this booklet. The booklet was planned to be distributed to the students at Northeastern University in a physical exhibition. Due to COVID-19, however, the test session will be moved online and launched in summer.
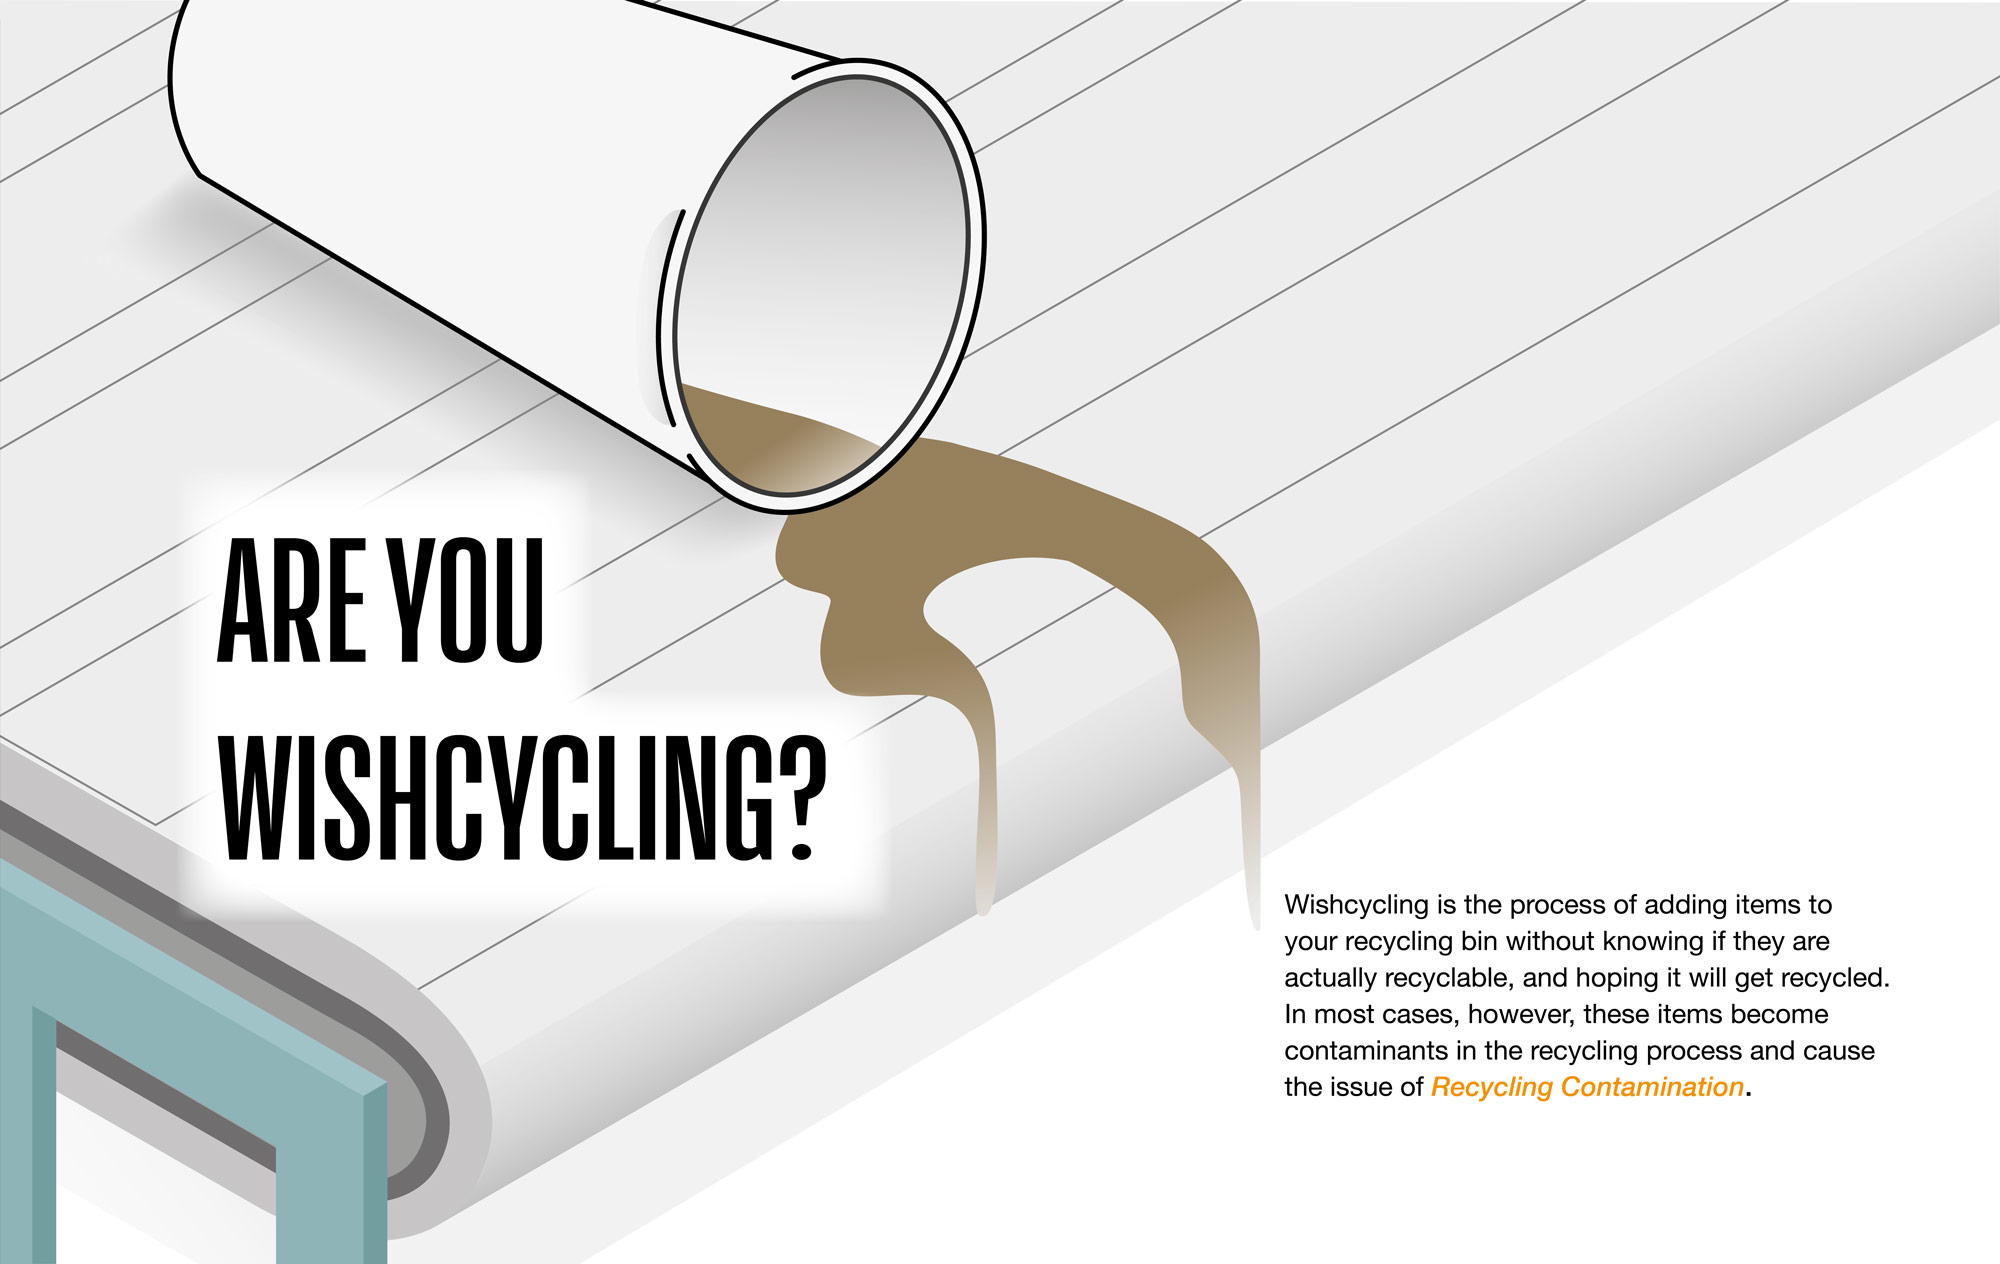
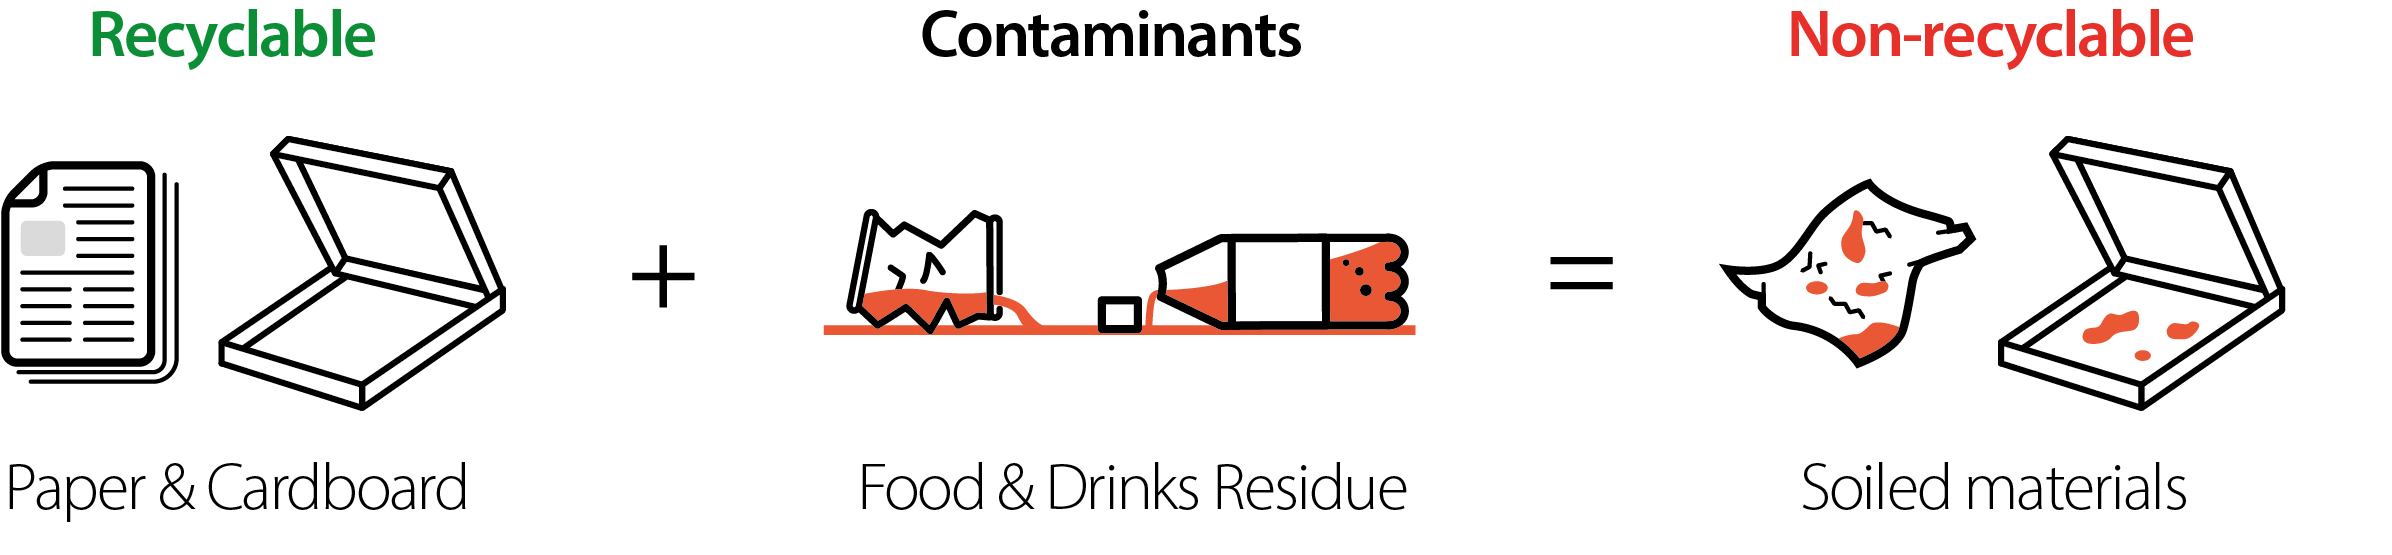
What is recycling contamination?
These two graphics introduce the common examples of contaminants and how to understand the contamination process.
Contamination occurs when non-recyclables are placed in recycling.It cpnsists of:
Wrong materials are sorted into recycling bins:The materials that are not recyclable by its original form (e.g., trash) or the theoretically recyclable materials that are not accepted in the local recycling system (e.g., plastic food wrapper).
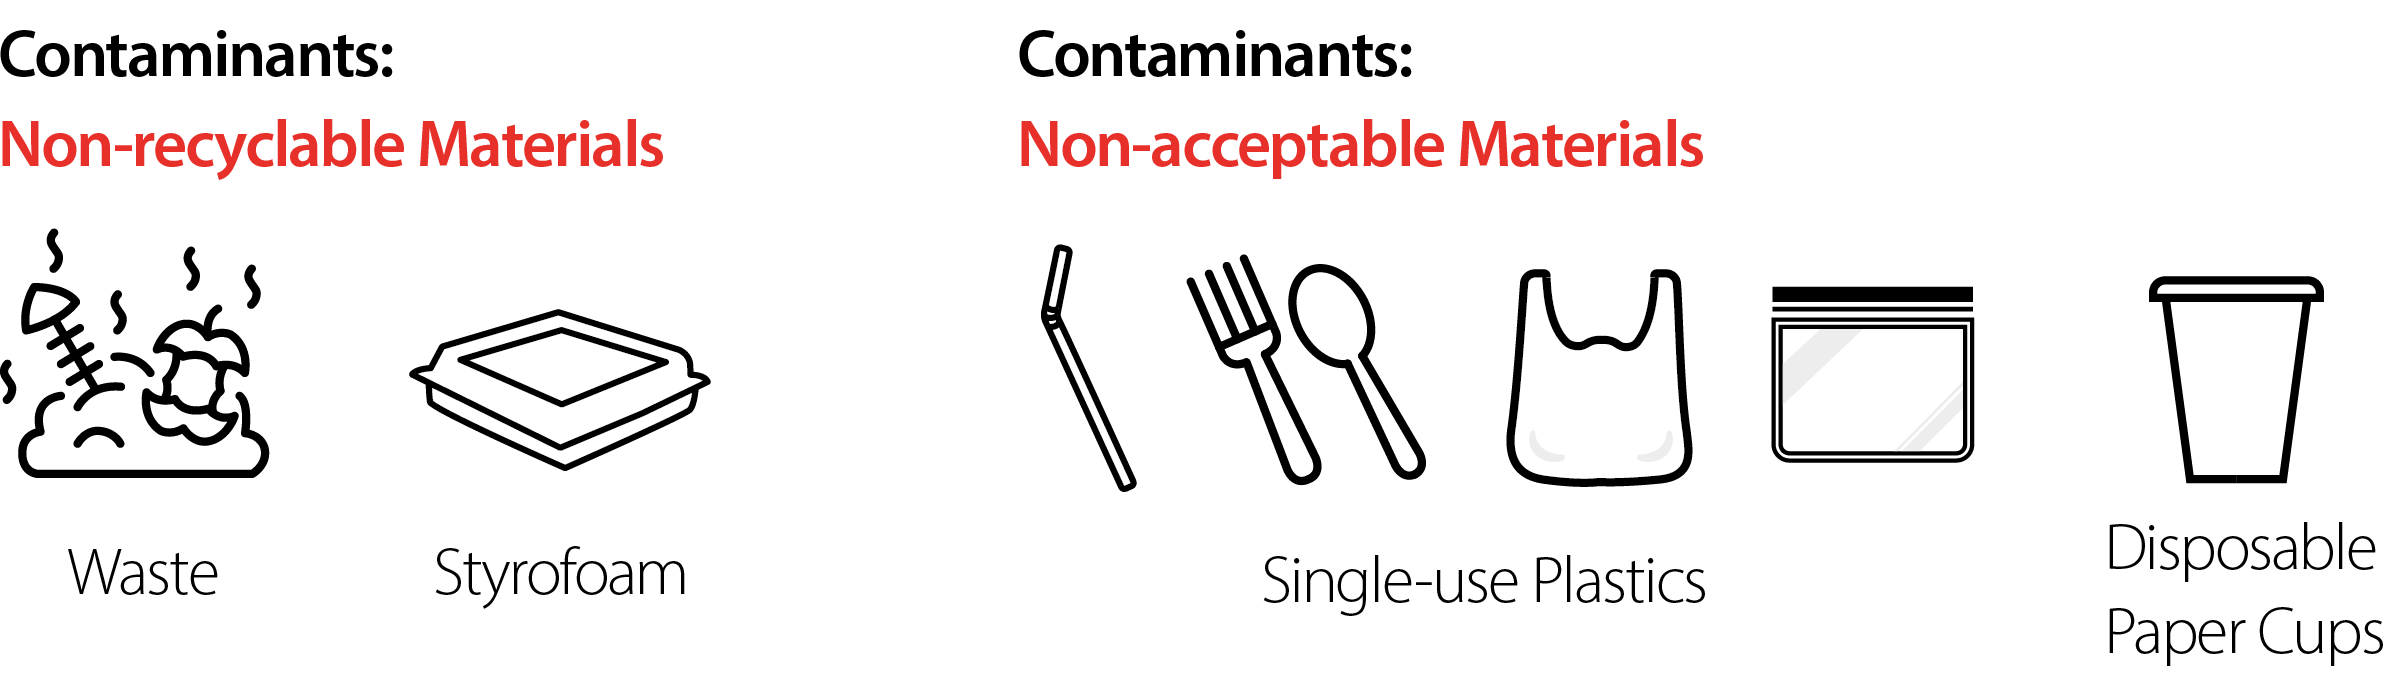
Materials are not properly cleaned:Food and drinks residue are a big problem in the recycling bin. It contaminates recyclable materials like paper and cardboard and turns them into trash.
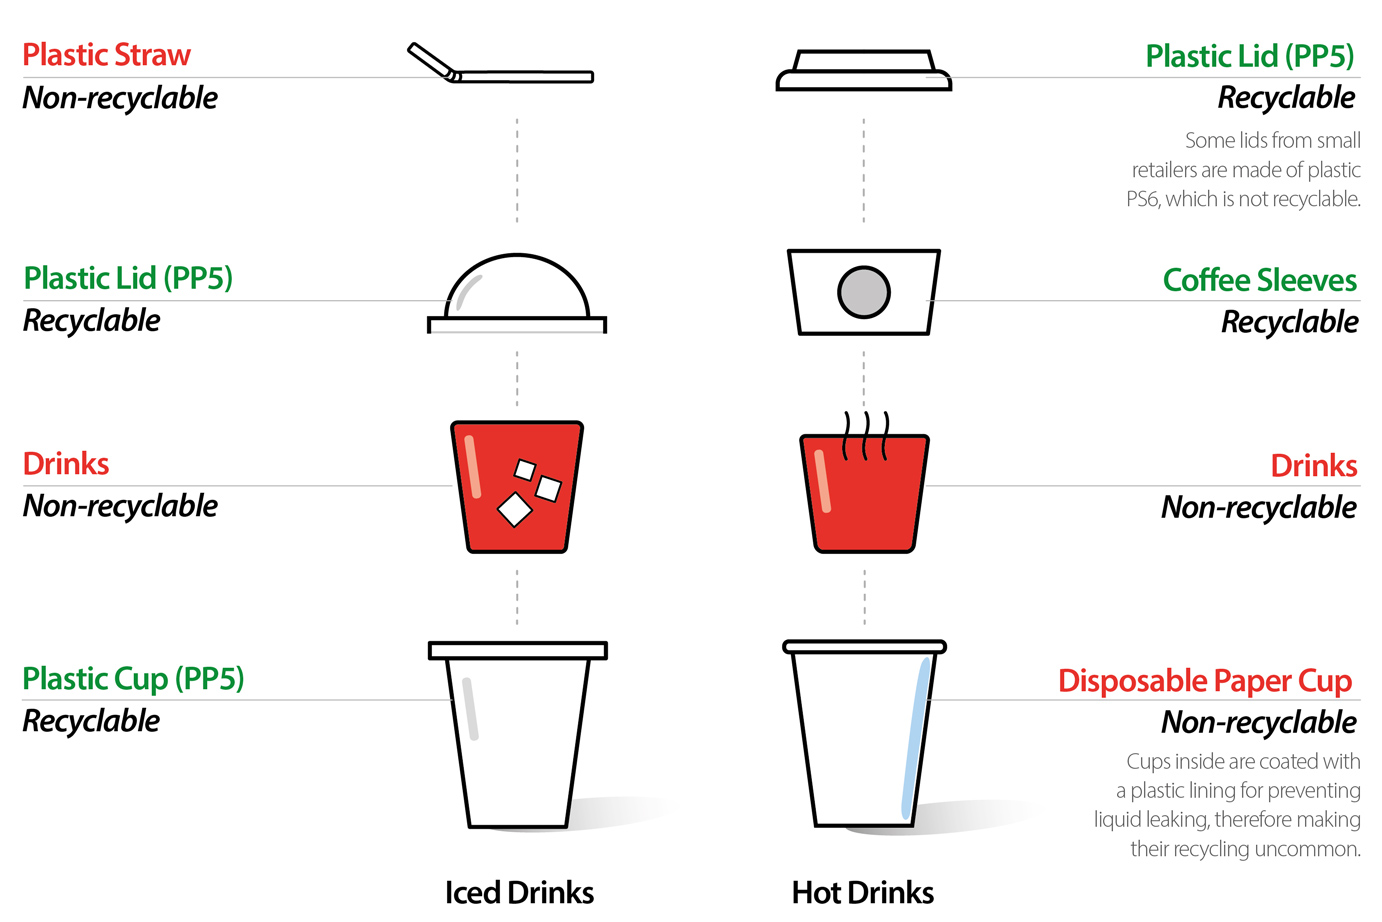
How to sort your disposable cup?

This infographic tries to inform the reader by deconstructing the ingredients of a hot/iced coffee cup to show which material is recyclable or not. It color-codes the recyclable materials in green and non-recyclable materials in red.
120 billion disposable cups are used by Americans each year. Everytime you get a cup of coffee, bubble tea, or any other take-away drink from a store, you contribute to that staggering number.
It can be seen everywhere that the whole coffee cups including paper cup, sleeves, and coffee lids, are lying in the recycling bin. However, the way to sort out the disposable coffee cup is quite tricky. Cups for hot and iced drinks have different sorting rules.
Contaminants hinder the recycling process

This infographic centers on the average contamination rate 25%. It sets the scene on the tipping floor in the MRF and uses a pile of recycling garbage mixed with contaminants to embody the data. There are 444 recycling garbages (black) and 111 contaminants (red) in the graphic. It also highlights five common contaminants in the recycling system.
This infographic centers on the average contamination rate 25%. It sets the scene on the tipping floor in the MRF and uses graphics to embody the data. The red dots in the left diagram coordinate with the red contaminants in the pile of recycling garbage on the right.