A Dancer’s Trace
Visualizing Movement in the Indian Classical Dance of Kathak
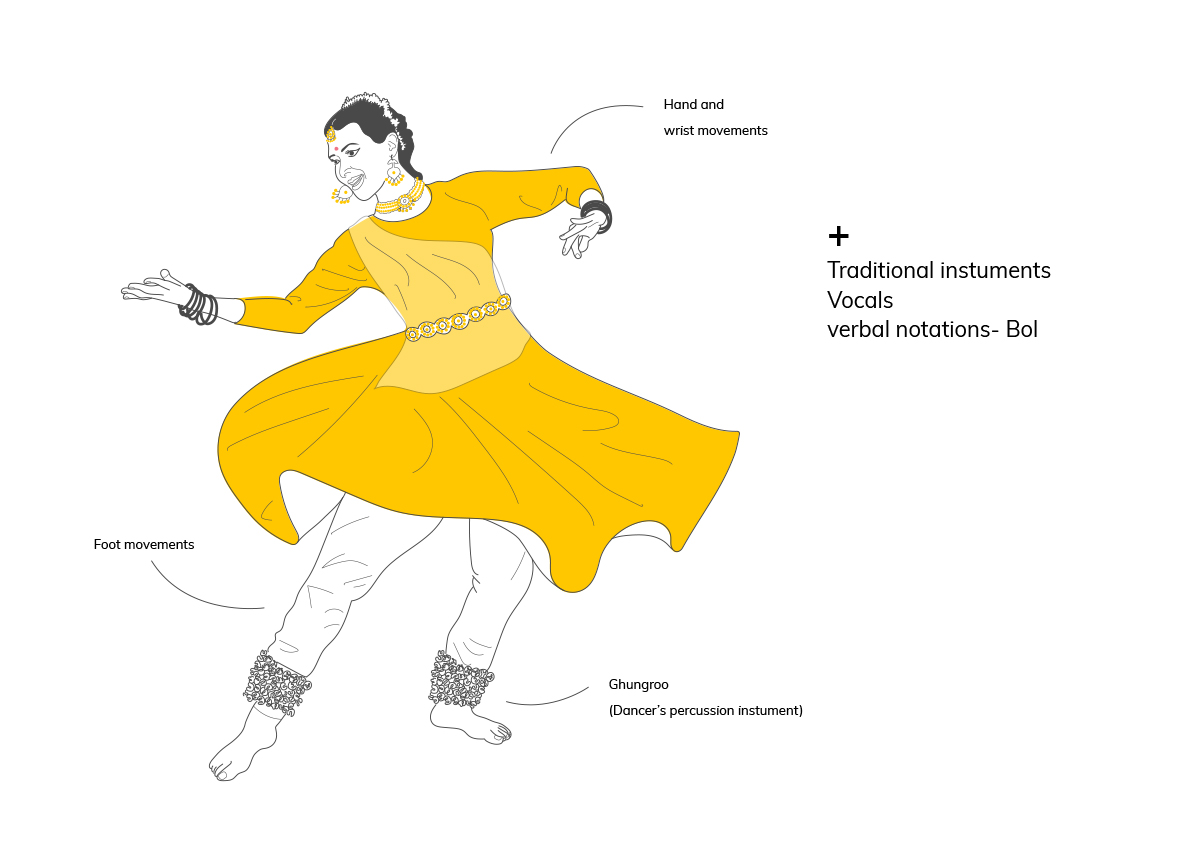
The goal of this project is to translate the intricate movements in the Indian classical dance of Kathak into abstract and expressive visualizations using non-traditional methods of capturing movement. Indian classical dance performances have traditionally been used to communicate spiritual ideas, stories, and values dating as far back as 400BCE. These performances are a combination of facial expressions, intricate and well-structured movements, compelling narratives as well as accompanying musicals to form a unique experience for the audience. Kathak, originating from Northern India, is characterized by its rhythmic footwork in tandem with graceful upper body movements.
Even though the audiences in a live Kathak performance experience the composition, the complex physical movements of feet and arms are often intermingled and difficult to isolate. Dancers have thus relied on fragmented notational renderings as a means to preserve these subtle bodily movements. Nevertheless, Kathak dancers leave traces of their performances in the environment after they leave. Capturing these traces encourages dance enthusiasts and curious audiences to take a more intimate look at the complex movements in Indian classical dance performances, especially Kathak.
| Designer | Arushi Singh |
|---|---|
| Keywords | classical dance, data art, experimental visualizations, performing arts |
| Advisor | Pedro M Cruz |
| More Info | arushisingh.net |

My approach to this thesis is a visualization design exploration which could allow information designers to not only challenge the existing knowledge of a phenomena (i.e. dance performance in this case) but also experience the phenomena by generating data in real time. I conducted these explorations using three inexpensive methods – tracing paint on paper, long exposure photography, and triaxial motion sensors to capture movement in Kathak dance.
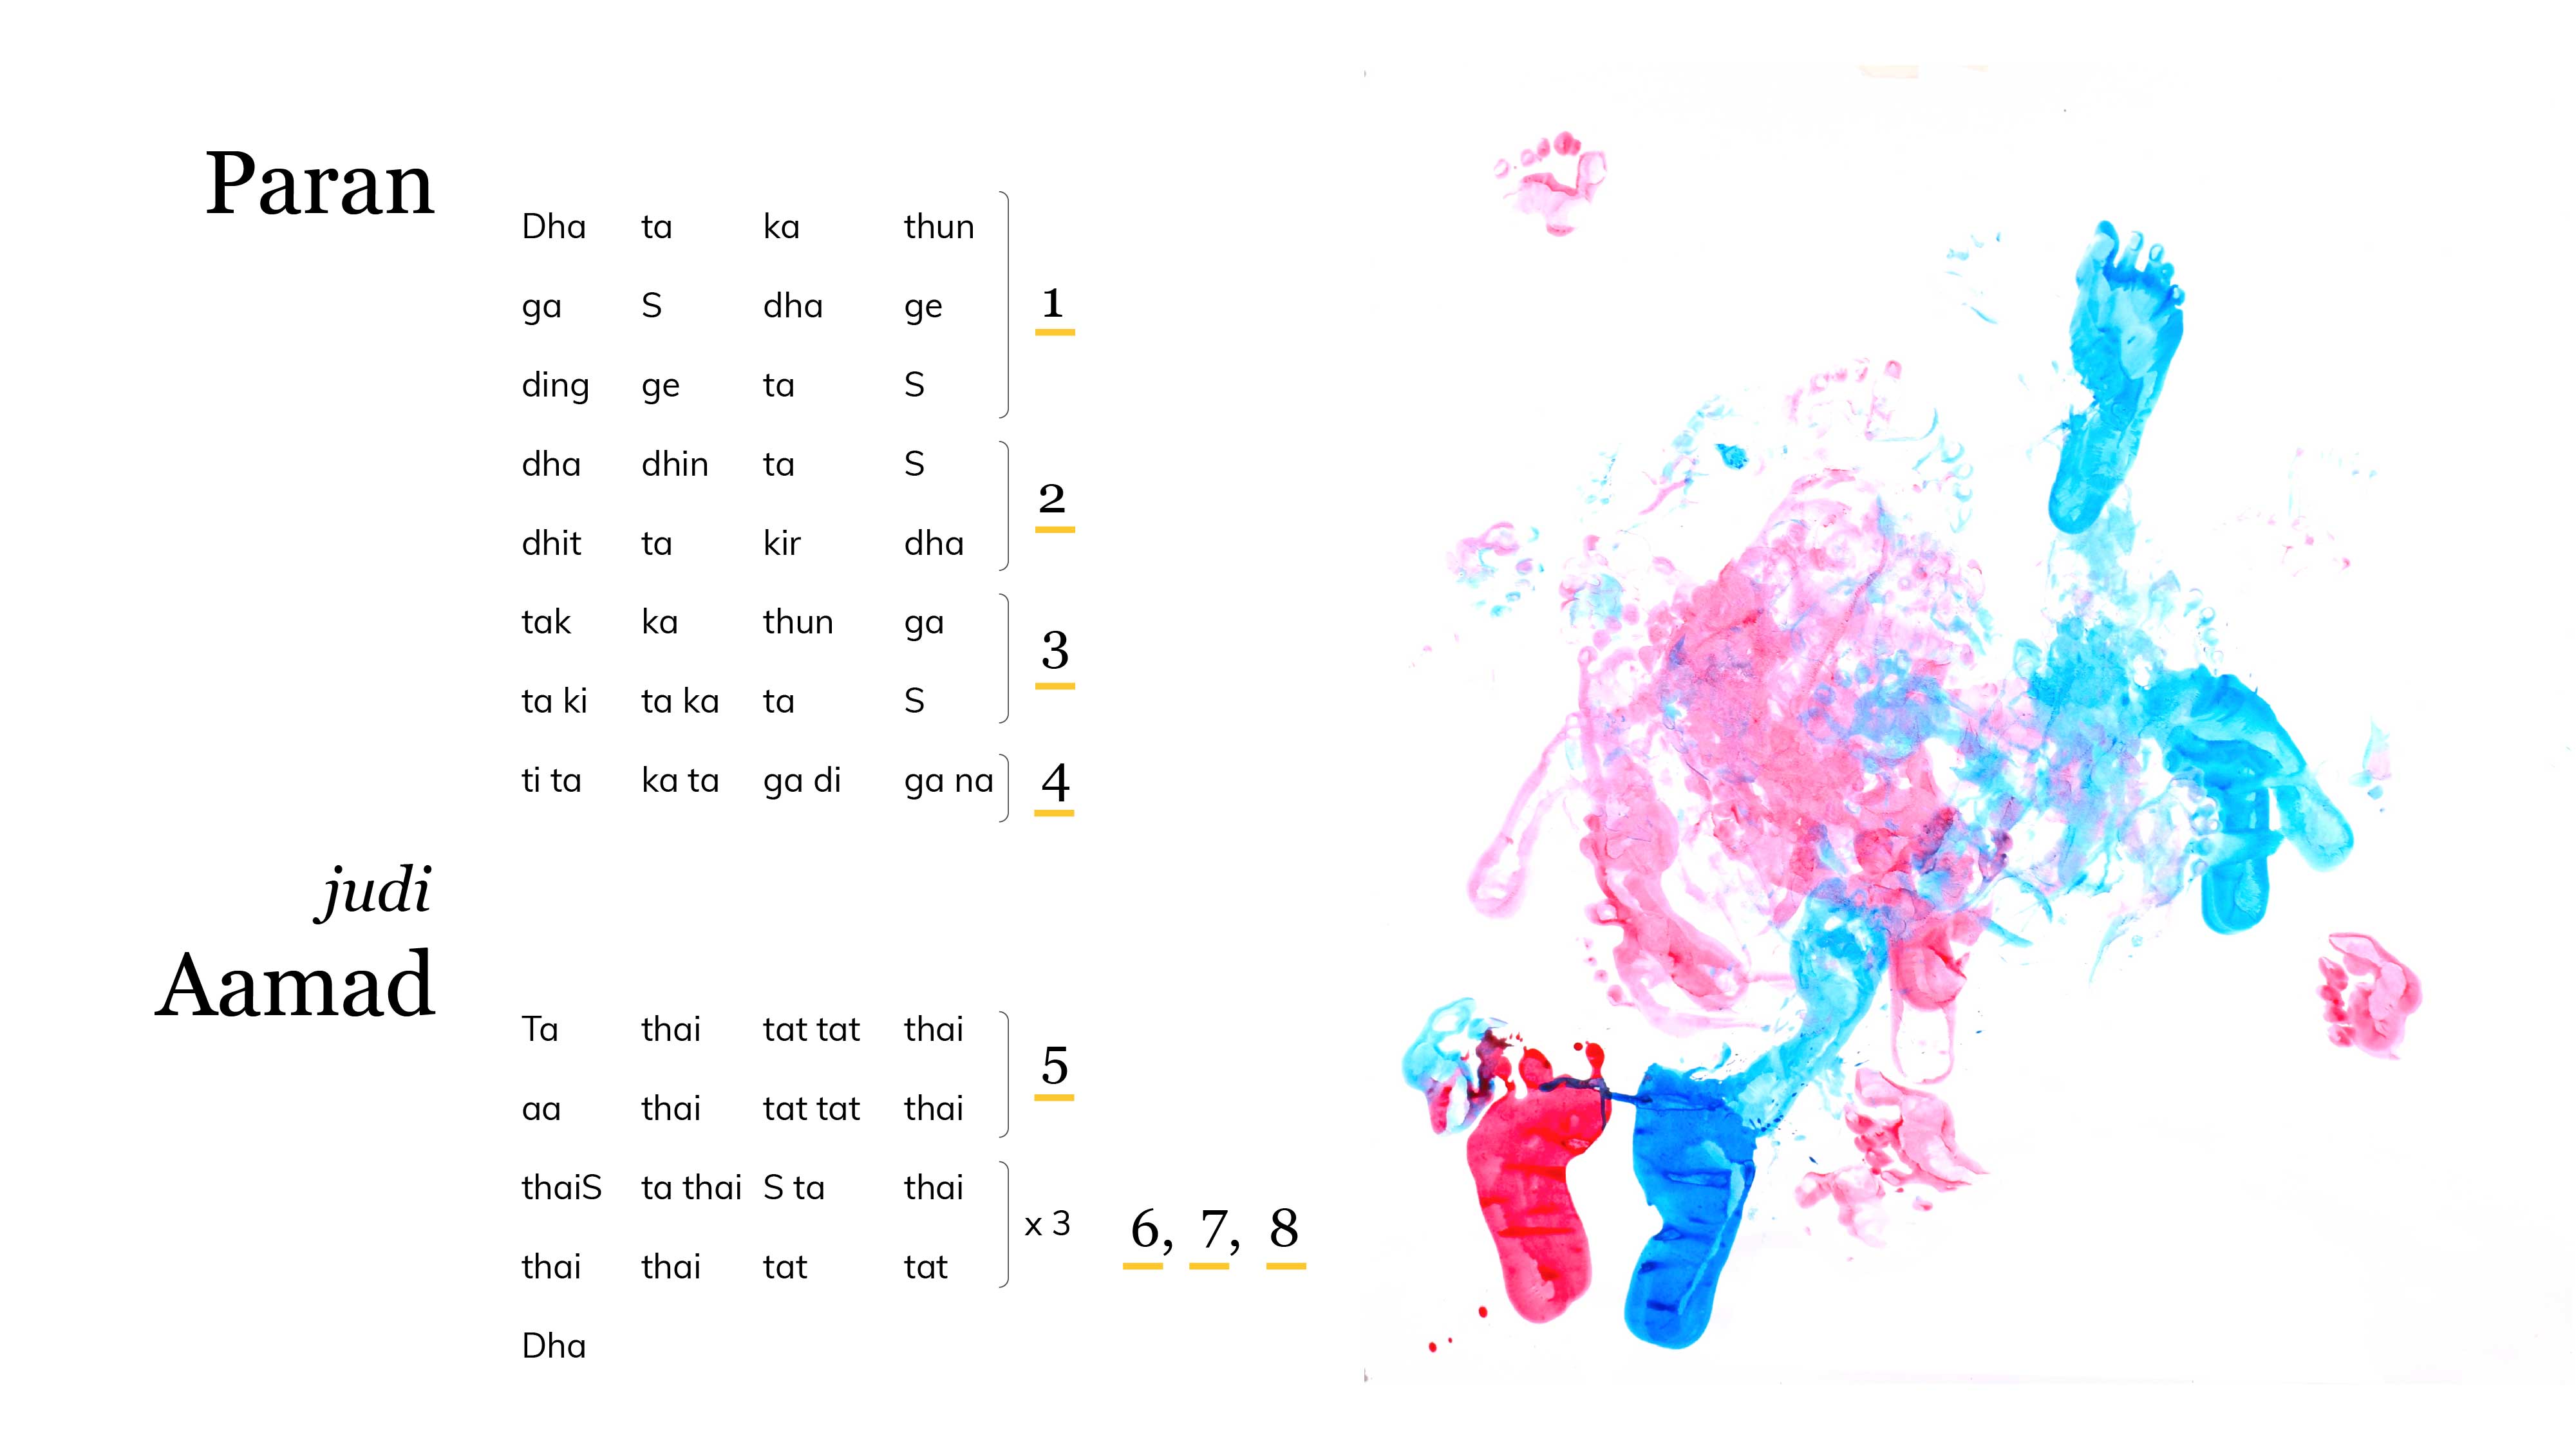
For this thesis, I have used a sample choreography by Guru Pali Chandra called "Paran judi Aamad". The verbal notations and choreography for this composition can be found in her online Kathak curriculum at Learn Kathak Online
01 Paint and movement
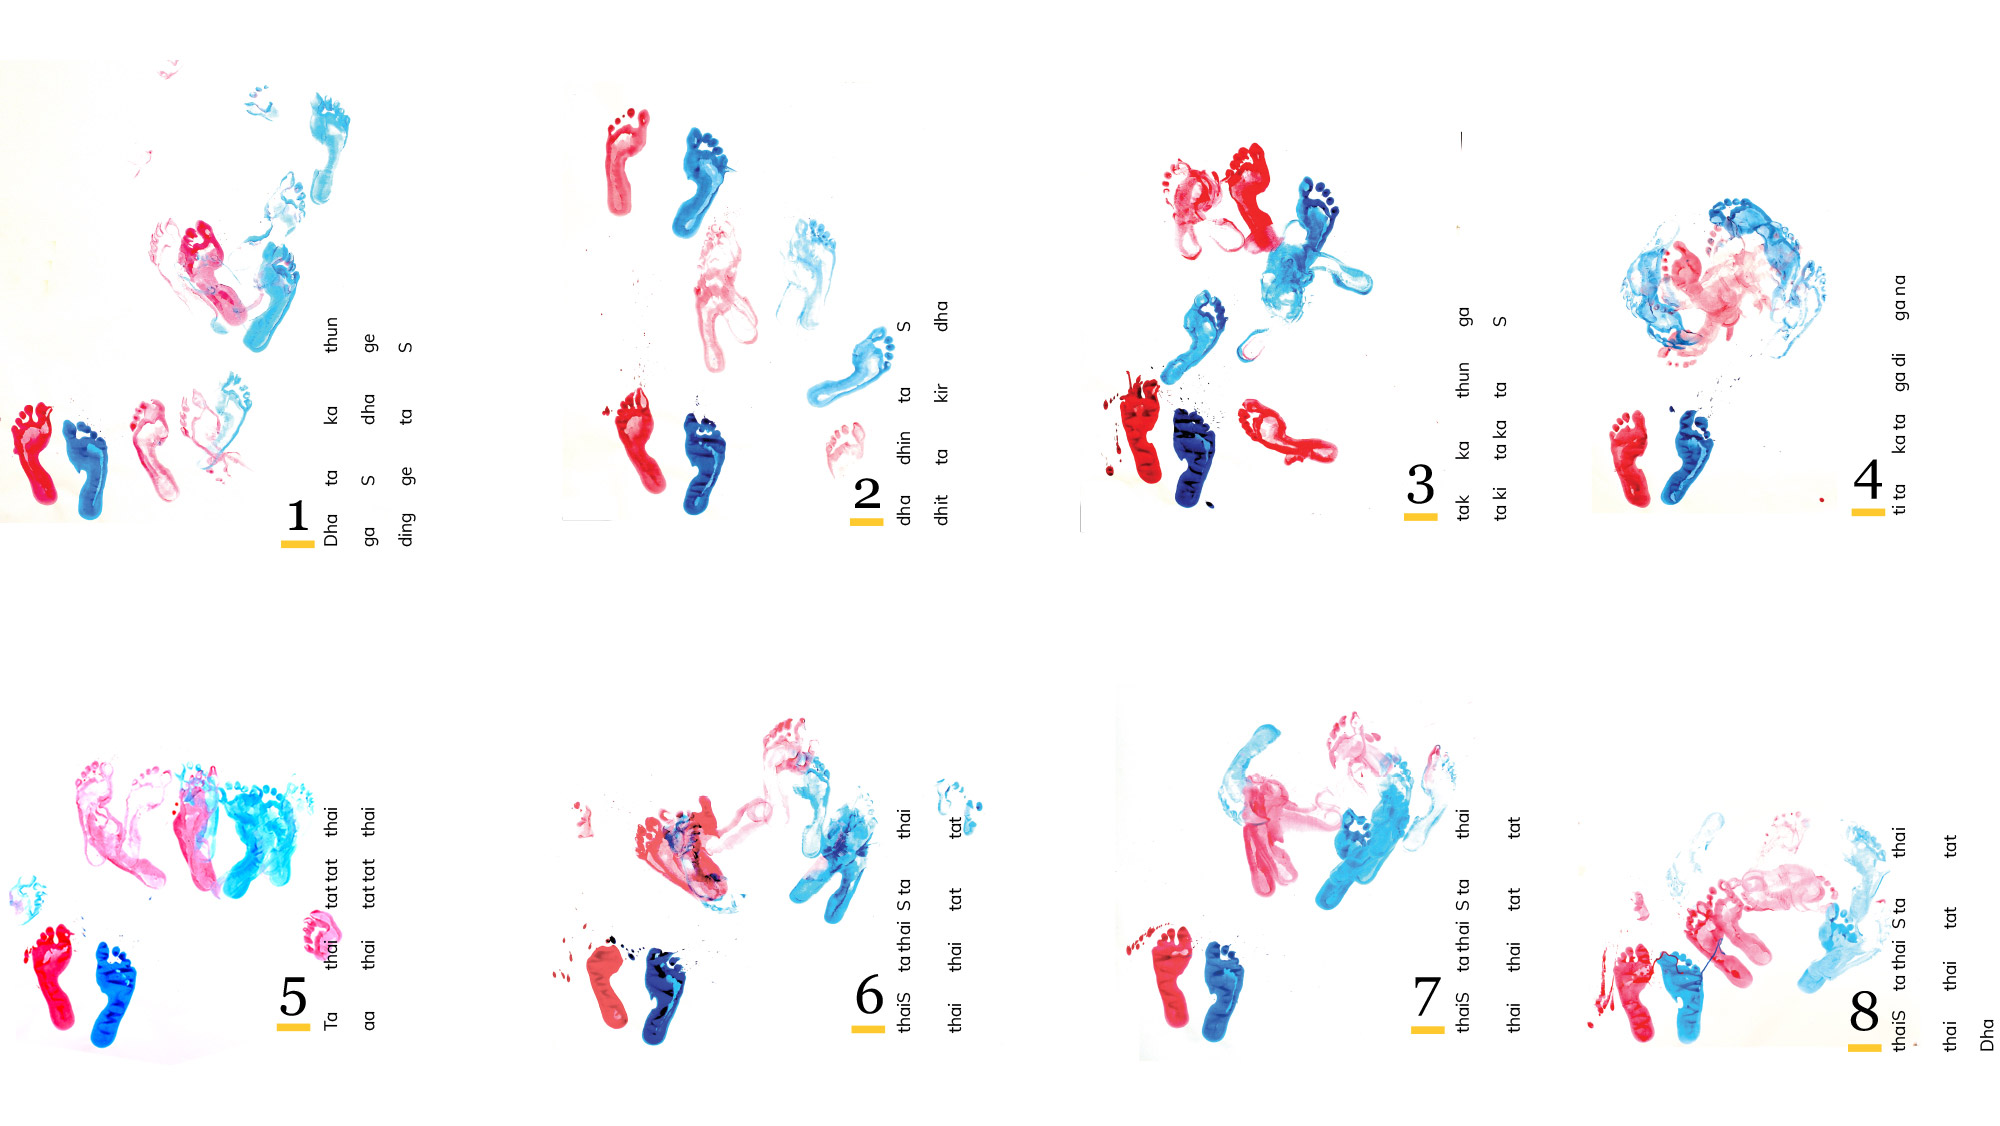
In order to capture the movement of the feet on the 2D plane of the floor, I used paint on paper to ink my feet and capture them on a white canvas placed on the floor while performing. This allowed me to break down the choreography into the eight sections and preserve the complex movements. The end result was a series of eight visualizations that gave more insights into the patterns of foot movement and use of the stage (i.e., the 2D space on the floor).
The set up to capture the dance footwork consisted of two cameras – a Go-Pro to capture the wide frame from top and a DSLR Canon E5 that focused on movement of the feet. I used different color paints (pink and blue) to distinguish between my left and right foot respectively.

02 Light and movement
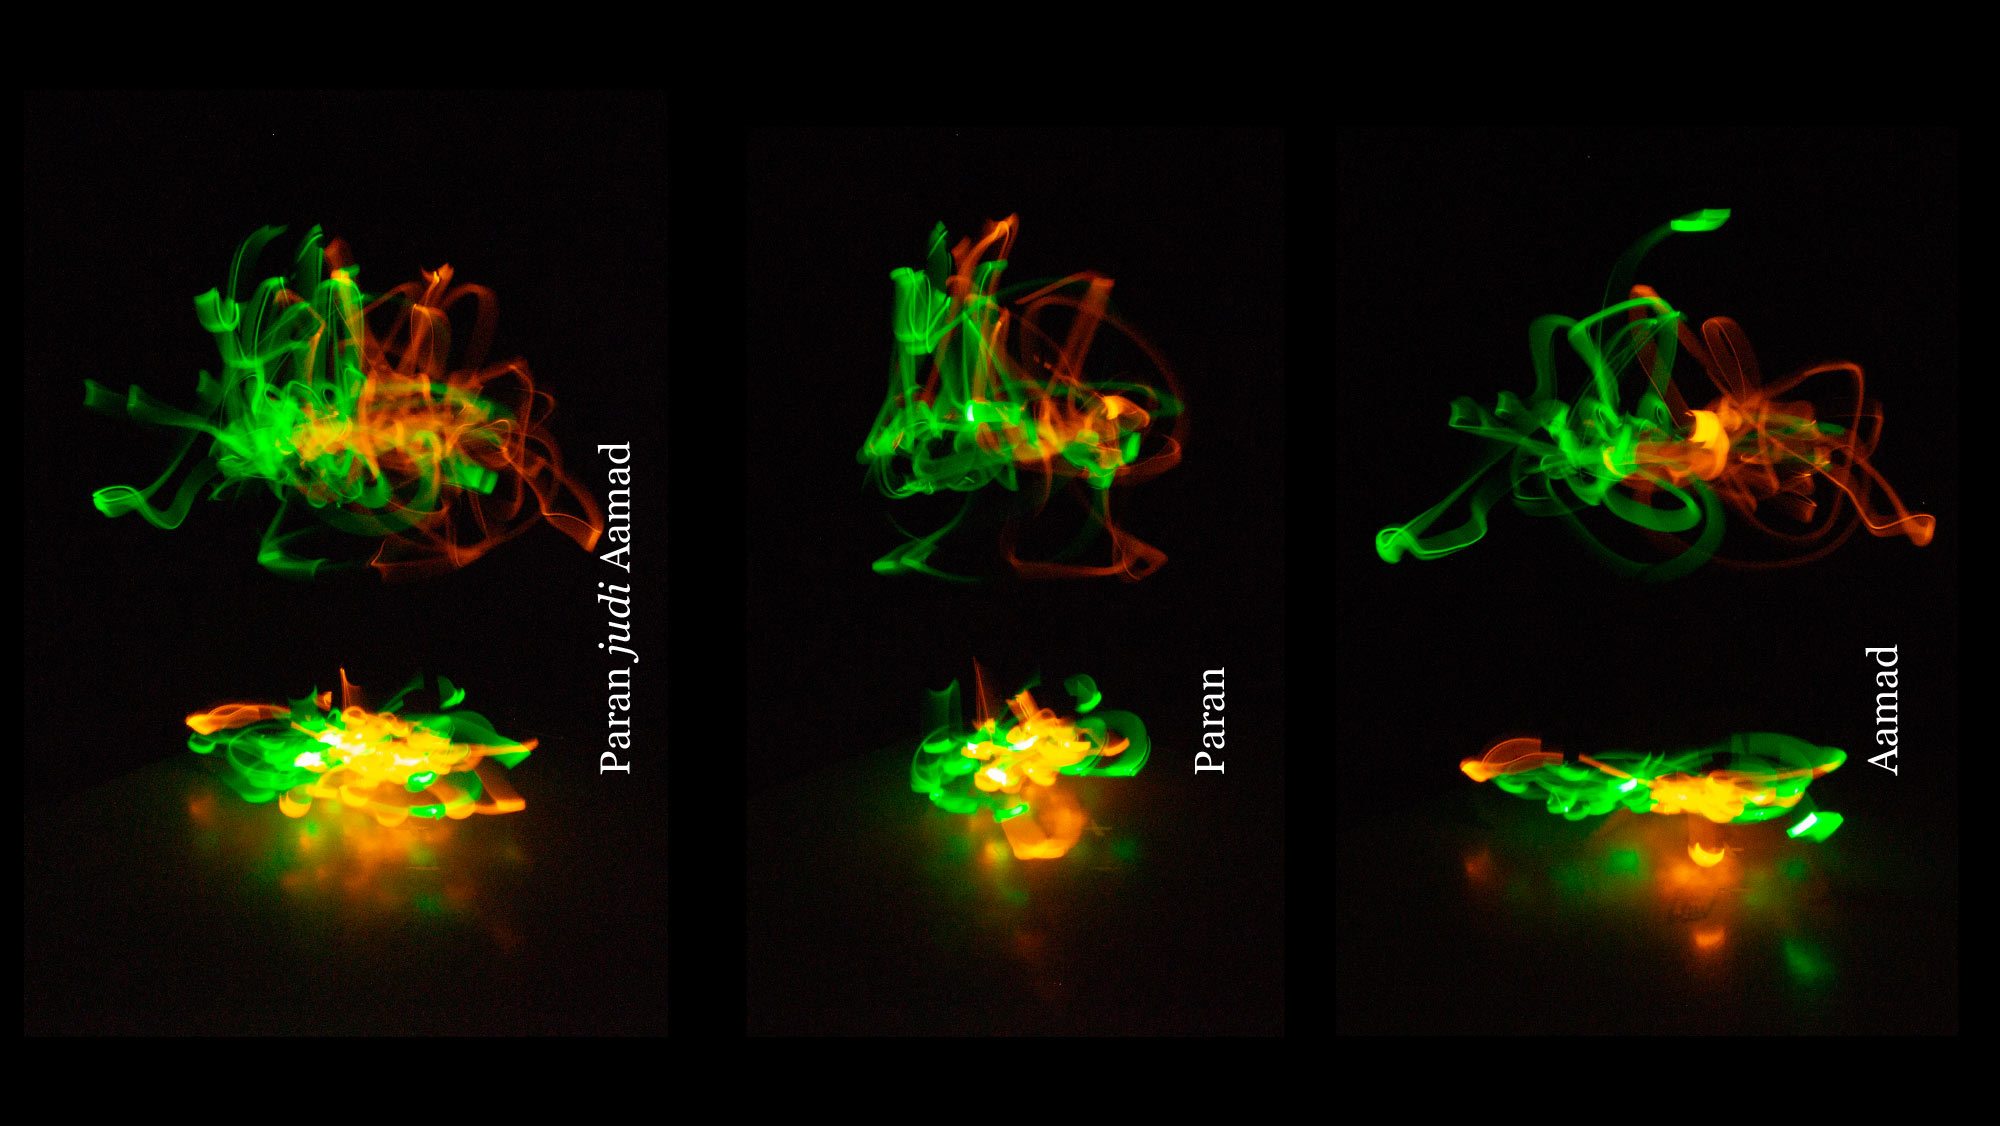
In this experiment, I used light painting and tracing to visualize movements in the same choreography. I used techniques in photography and videography to track dance movements emitting from light sources attached to the body. I wore different colored LED light sources on my wrists (green color for right wrist and yellow color for left wrist) and ankles (green color for right ankle and yellow color for left ankle). The dance movements were captured in a video recording studio (turned into a dark room) at Northeastern University, Boston, MA.
In addition to the movement, I also captured the sound of the choreography – the sound of the ghungroos, bols, and the sounds of the slapping of the foot. The sound was recorded in the audio recording room of Northeastern University. The setup for this included three microphones placed on the floor, with one in front and two on both sides of the body.


1.LED bands for the ankles and 2.hands 3.Camera setup 4.Ribbon microphones to capture ambient sound 5.Diaphragm condenser microphone for capturing the sound of the ghungroo and foot tapping.
03 Data and movement
Wearable sensors like accelerometers provide highly precise motion data at a high sampling rate. I used these sensors in my experiment to explore movement intensity of the selected choreography.
For this experiment, I used four accelerometers two on my wrists and two on my ankles. The accelerometers were charged and pre-calibrated at a sampling rate of 80Hz. These devices collected acceleration along X, Y, and Z axes with the timestamp of the recording.

1.Ankle acelerometers worn above the ghungroos 2.Wrist bands 3.Actigraph accelerometers
Conclusion
Through this thesis, I visualise some of the core properties of dance in general and Kathak in specific – the graceful arm movements and rhythmic footwork. I discuss the merits of experimentation as a process in data visualisation. I illustrate this by the case study of visualising complex and ephemeral movements in dance.
Finally, I present the importance of the medium and technique of capturing the data for a phenomenon for creating visualisations. Information designers can use the medium as a lens to view a complex phenomenon and visualise its different components.